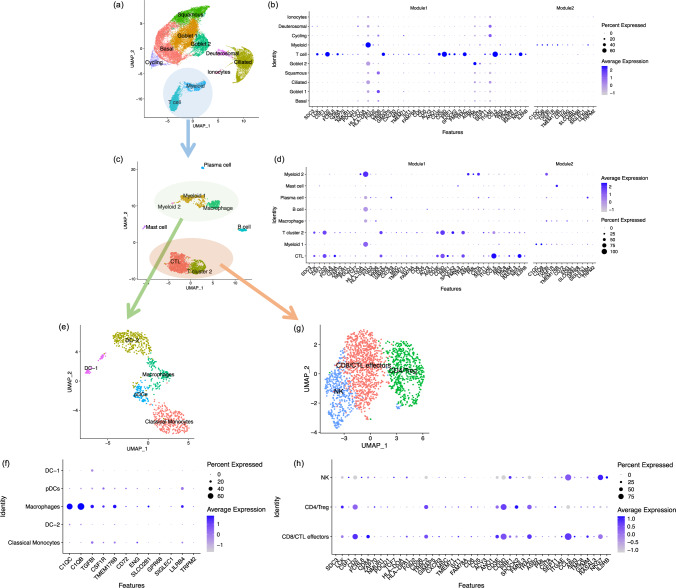
Fig. 5. Expression patterns of genes associated with three CpG sites in different cell types.
Using single-cell data, we identified ten cell types in nasal brushing cells (a). We identified two gene modules from eQTM genes by Weighted Gene Co-expression Network Analysis (WGCNA). Plot (b) depicts the average expression levels per cell cluster of genes from Module 1 and Module 2, which were available in the nasal scRNA-seq dataset in all cell types. Genes from Module 1 were highly expressed in the T cell cluster and genes from Module 2 were enriched to myeloid cells. After re-clustering of all immune cells from the two immune clusters, we identified seven immune cell clusters (c). Plot (d) showing the genes from Module 1 was enriched to T cell clusters and genes from Module 2 was enriched to myeloid cell clusters. Further re-clustering of T cell cluster (g) and myeloid cell cluster (e) respectively identified that genes from Module 1 were enriched to CD8/CTL effectors and CD4/ Treg cells (h), while genes from Module 2 were enriched to macrophages (f). CTL cytotoxic T lymphocyte, DC dendritic cell, pDCs plasmacytoid dendritic cells, NK nature killer cell, Treg regulatory T cell.

