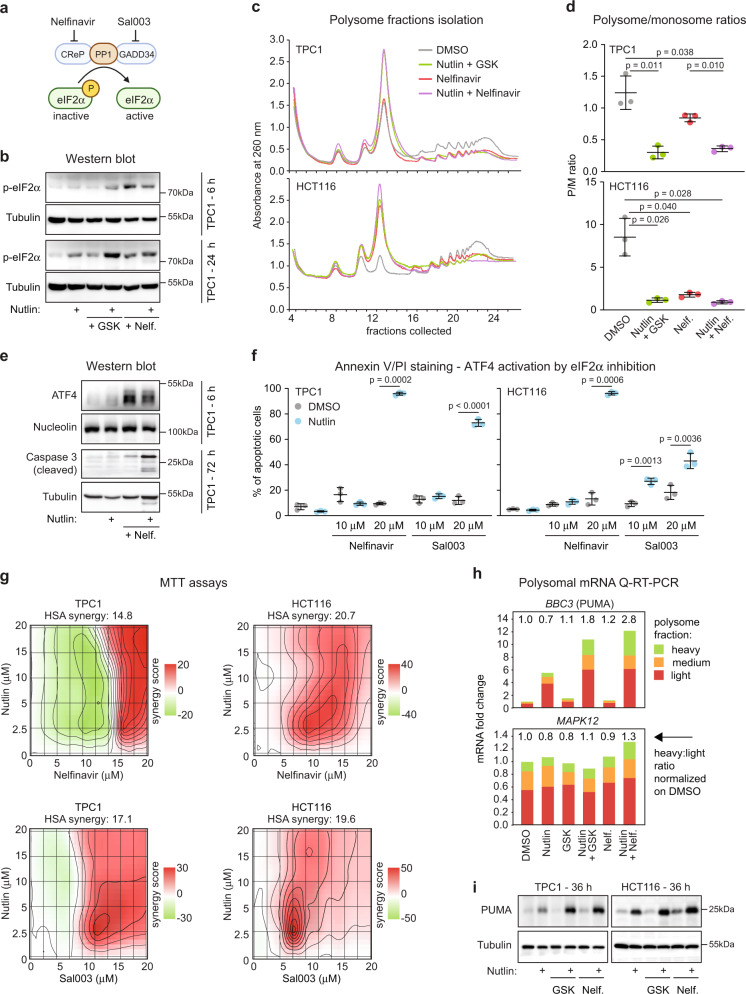
Fig. 4. Pharmacological inhibition of eIF2α synergizes with nutlin to induce cell death.
a Schematic of eIF2α inhibition by nelfinavir and sal003. Created with BioRender.com. b Western blots of cells treated with vehicle (0.2% DMSO), 10 μM nutlin-3a, 25 μM GSK2830371 (GSK), 20 μM nelfinavir (Nelf.), and drug combinations for indicated times. p-eIF2α indicates S51 phosphorylation. c Representative polysome profiles of cells treated with indicated compounds for 24 h. d Quantification of polysome to monosome ratio in polysome profiles from c (area under the curve, n = 3 independent experiments). Data are represented as mean ± SD. Statistical significance was calculated using paired, two-sided t test. e Western blots in TPC1 cells treated as indicated. f TPC1 and HCT116 cells were treated with indicated compounds for 48 h. Fraction of apoptotic cells was determined by flow cytometry. Data are represented as mean ± SD. Paired, two-sided t test was used for calculations of statistical significance (n = 3 independent experiments). g Absorbance values from using MTT assays were analyzed with SynergyFinder107. The degree of combination synergy was calculated using highest single agent (HSA) reference model. Synergy of specific concentrations (synergy score) was plotted to show synergy distribution. The higher the score, the stronger the synergy at those concentrations. h Q-RT-PCR of RNA isolated from polysome fractions of TPC1 cells as shown in c and in Fig. 3c. Light polysome samples were prepared with fractions 19-21, medium with fractions 22-23, and RNA associated with heavy polysomes was isolated from fractions 24 and 25. i Western blots in TPC1 and HCT116 cells treated as indicated for 36 h. See also Supplementary Fig. 6. Results shown in b, e, i are representative of three independent experiments. Source data are provided as a Source data file.

