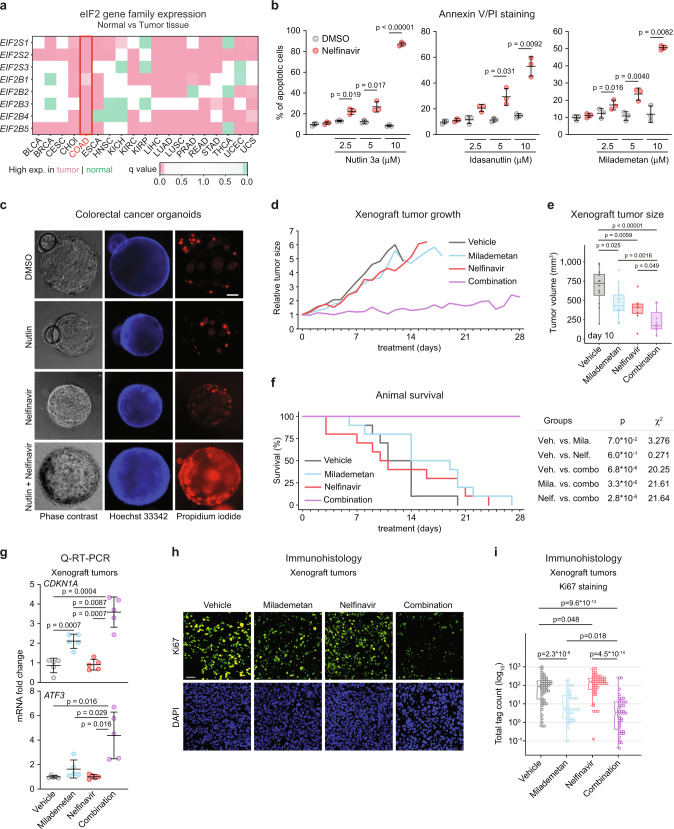
Fig. 5. Reduced tumor growth and extended survival by combined inhibition of MDM2 and eIF2α.
a Normalized mRNA expression of eIF2 complex subunits in normal and tumor samples obtained from TCGA and GTEx databases. Statistical significance was calculated using Wilcoxon signed-rank test. BLCA: bladder urothelial carcinoma (n normal = 28, n tumor = 362 independent samples), BRCA: breast invasive carcinoma (n normal = 199, n tumor = 982 independent samples), CESC: cervical squamous cell carcinoma and endocervical adenocarcinoma (n normal = 9, n tumor = 31 independent samples), COAD: colon adenocarcinoma (n normal = 380, n tumor = 285 independent samples), ESCA: esophageal carcinoma (n normal = 278, n tumor = 183 independent samples), HNSC: head and neck squamous cell carcinoma (n normal = 42, n tumor = 460 independent samples), KICH: kidney chromophobe carcinoma (n normal = 57, n tumor = 60 independent samples), KIRC: kidney renal clear cell carcinoma (n normal = 104, n tumor = 475 independent samples), KIRP: kidney renal papillary cell carcinoma (n normal = 61, n tumor = 236 independent samples), LIHC: liver hepatocellular carcinoma (n normal = 163, n tumor = 295 independent samples), LUAD: lung adenocarcinoma (n normal = 372, n tumor = 503 independent samples), LUSC: lung squamous cell carcinoma (n normal = 364, n tumor = 489 independent samples), PRAD: prostate adenocarcinoma (n normal = 154, n tumor = 426 independent samples), READ: rectum adenocarcinoma (n normal = 349, n tumor = 87 independent samples), STAD: stomach adenocarcinoma (n normal = 225, n tumor = 380 independent samples), THCA: thyroid carcinoma (n normal = 371, n tumor = 441 independent samples), UCEC: uterine corpus endometrial carcinoma (n normal = 105, n tumor = 141 independent samples), UCS: uterine carcinosarcoma (n normal = 82, n tumor = 47 independent samples). b HCT116 cells were treated with 20 μM nelfinavir and indicated MDM2 inhibitors for 48 h, stained with Annexin V-FITC/PI and analyzed by flow cytometry. Data are represented as mean ± SD. Statistically significant differences (n = 3 independent experiments) were calculated by paired, two-sided t test. c PDX-derived line CRC172 colorectal cancer organoids were treated for 48 h with vehicle (0.2% DMSO), 10 μM nutlin-3a, 20 μM nelfinavir, and drug combination. Organoids were live-stained with propidium iodide and Hoechst 33342. Scale bar is 50 μm long. d Therapeutic effects of milademetan (200 mg/kg), nelfinavir (200 mg/ml), and drug combination administered by oral gavage once daily 5 days/week in nude mice bearing HCT116 xenograft tumors. Average initial tumor size was 183 ± 127 mm3 (see Supplementary Fig. 5b). Ten animals per treatment group were used in the study and datapoints with n ≧ 3 were plotted. Relative tumor sizes represent average volumes of both tumors in the animal. e Comparison of tumor volumes measured at day 10 following the indicated treatments. Tumors from each flank are plotted as individual values. Statistically significant differences (n vehicle = 12, n milademetan = 14, n nelfinavir = 8, n combination = 14) were calculated by unpaired, two-sided t test. f Animal survival of nude mice carrying HCT116 xenograft tumors. Animals were sacrificed at the humane endpoint when tumor volume exceeded 1000 mm3. Statistical significance was calculated by log-rank test. g Q-RT-PCR of CDKN1A and ATF3 mRNAs in RNA extracted from tumors. Data are represented as mean ± SD. Unpaired, two-sided t test was used to calculate the indicated p value (n = 5 tumor samples from 5 individual animals per group). h, i Formalin-fixed xenograft tumors were stained with DAPI and Ki67 antibody. Nuclei were identified and scored using InForm software. Scale bar in h is 50 μm long. Statistical significance in i was calculated using Wilcoxon signed-rank test (n = 55 fluorescence values in 55 randomly subsampled cells from >19,900 per group. Histology samples were obtained from 3 animals per group). Box plots center lines in e, i represent median values, box boundaries outline the 25th and 75th percentile. Whiskers depict the smallest or largest values within 1.5 times of the interquartile range. See also Supplementary Fig. 7. Source data are provided as a Source data file.

