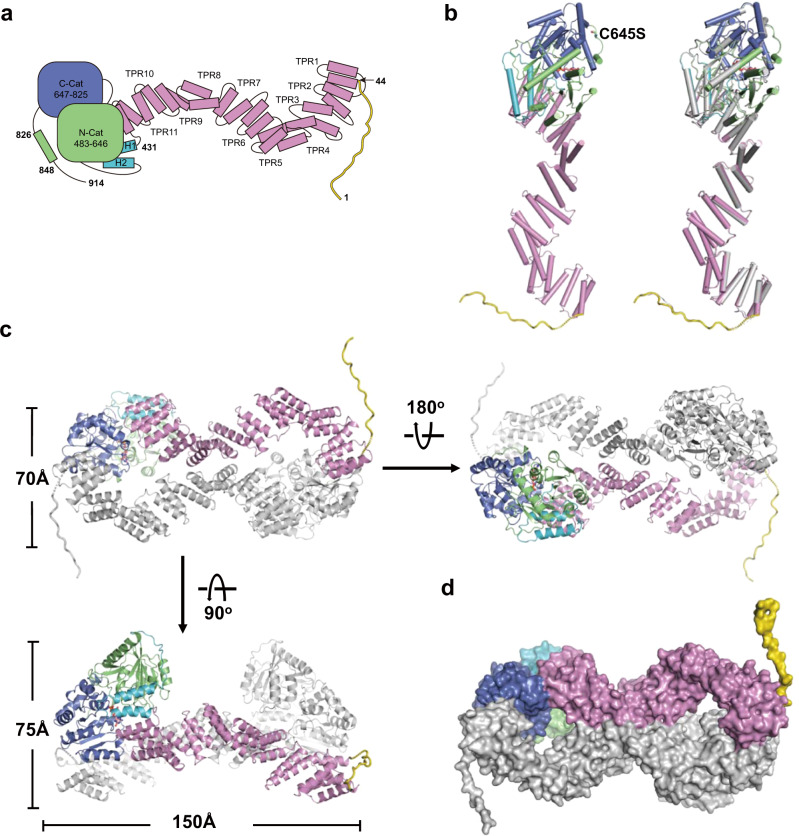
Fig. 1. Structure of SPY/GDP complex.
a Schematic diagram of Arabidopsis SPY. The N-terminal loop, the TPR domain, the connector region, the N-Cat lobe and the C-Cat lobe are colored in yellow, pink, turquoise, green and purple, respectively. b Left panel is the structural overview of the SPY/GDP complex in cartoon representation. The C645S and GDP are shown in ball-and-stick model and colored in magenta and salmon, respectively. Right panel is the structural comparison of the two protomers in the SPY dimer. One protomer is colored the same as the schematic in a and the other protomer is colored in gray. c Overall structure of SPY dimer. One protomer is colored the same as the schematic in a and the other protomer is colored in gray. d Surface representation of the SPY dimer.

