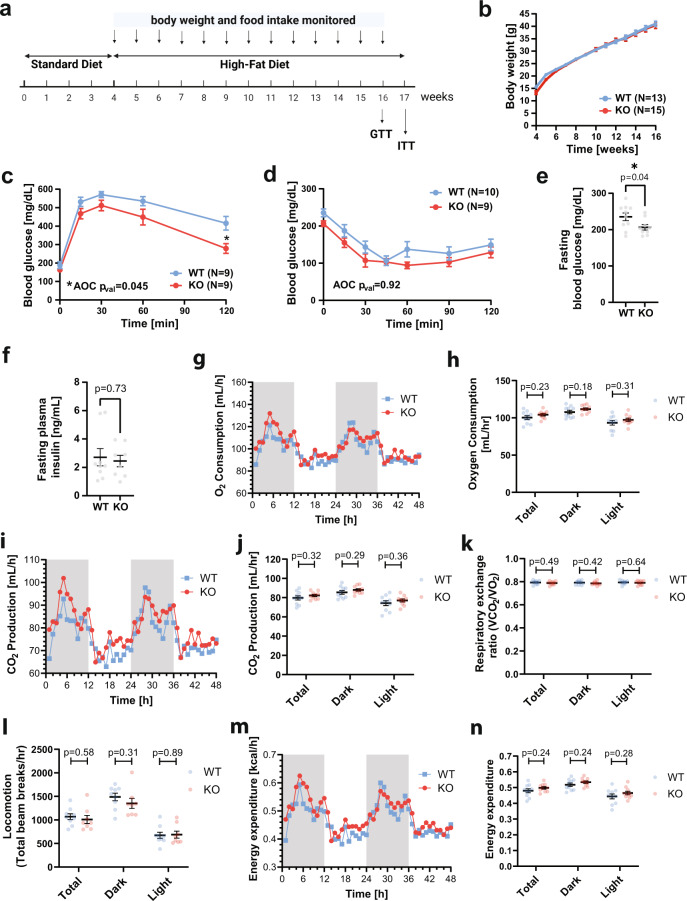
Fig. 1. Gpr151 loss improves glucose metabolism in DIO male mice which is not explained by behavioral differences.
a Schematic of the experiment to determine the effect of Gpr151 loss on metabolic health in mice using the DIO model. Image created using Biorender. b Body weight in male DIO KO and WT mice over 12 weeks of HFD (N = 13, WT; N = 15, KO). Data are presented as mean values ±SEM. c Blood glucose levels measured during glucose tolerance testing in Gpr151 KO and WT DIO males. Data are presented as mean values ±SEM. Area of the curve (AOC) compared using two-tailed Student’s t test. Student’s t test with Bonferroni correction used to test differences at every time point (N = 9, WT; N = 9, KO; *t = 120 qval = 0.02). d Blood glucose levels measured during insulin tolerance testing in Gpr151 KO and WT in DIO male mice (N = 10, WT; N = 9, KO). Data are presented as mean values ±SEM. AOC compared using two-tailed Student’s t test. e Fasting glucose levels in Gpr151 WT and KO DIO male mice measured in whole blood (N = 10, WT; N = 9, KO). Data are presented as mean values ±SEM. Two-tailed t Student test. f Fasting insulin levels measured in blood plasma of DIO male mice (N = 9, WT; N = 8, KO). Data are presented as mean values ±SEM. Two-tailed Student’s t tests. g–n Metabolic phenotyping of DIO male mice using CLAMS, conducted at 23 °C. g Representative time course of oxygen consumption (N = 5, WT; N = 5, KO). h Average oxygen consumption (N = 10, WT, N = 10, KO). Data are presented as mean values ±SEM. Two-tailed Student’s t tests. i Representative time course of CO2 production (N = 5, WT; N = 5, KO). j Average CO2 production (N = 10, WT; N = 10, KO). Data are presented as mean values ±SEM. Two-tailed Student’s t tests. k Average respiratory exchange ratio (N = 10, WT; N = 10, KO). Data are presented as mean values ±SEM. Two-tailed Student’s t tests. l Average locomotion measured as average number of beam breaks per hour (N = 9, WT; N = 8, KO). Data are presented as mean values ±SEM. Two-tailed Student’s t tests. m Representative time course of energy expenditure (N = 5, WT; N = 5, KO). n Average energy expenditure (N = 10, WT; N = 10, KO). Data are presented as mean values ±SEM. Two-tailed Student’s t tests. *p < 0.05. Source data are provided as a Source Data file.

