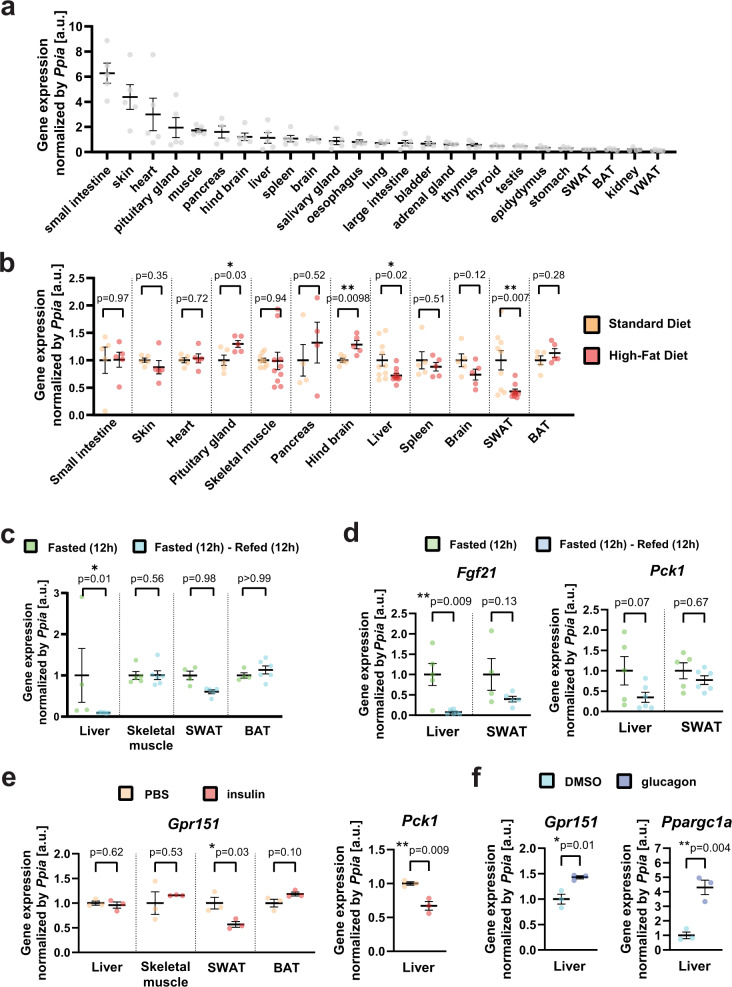
Fig. 2. Gpr151 expression is upregulated by fasting and glucagon in the liver.
a RT-qPCR quantification of Gpr151 expression in the tissues of eight-week-old male c57BL/6 J mice (N = 5). b RT-qPCR quantification of Gpr151 expression in the 10 top-expressing tissues and the metabolically relevant tissues in HFD-fed mice compared to the same tissues from SD-fed mice. All mice were 16-week-old male c57BL/6 J mice (N = 4, SD; N = 4, HFD). Two-tailed Student’s t tests. c RT-qPCR quantification of Gpr151 expression in the liver, SWAT, BAT and skeletal muscle of mice which were fasted for 12 h and then refed for 12 h, normalized by Gpr151 expression in the same tissues of mice fasted for 12 h. All mice were eight-week-old male c57BL/6J. Ordinary one-way ANOVA (N = 5, fasted; N = 5-6, refed). d Quantification of Fgf21 expression in the liver and SWAT of fasted-refed and fasted mice. Ordinary one-way ANOVA (N = 5, fasted; N = 5–6, refed). e Gpr151 expression in the liver, skeletal muscle, SWAT and BAT in insulin-injected mice compared to the same tissues of PBS-injected mice, quantified by RT-qPCR. Quantification of Pck1 expression in the liver shown as a positive control. Eight-week-old male c57BL/6J mice (N = 3, PBS-injected; N = 3, insulin-injected). Two-tailed Student’s t tests. f Gpr151 expression in the liver of glucagon-injected mice compared to the livers of control mice (vehicle-injected), quantified by RT-qPCR. Quantification of Ppargc1a expression in the liver shown as a positive control. Eight-week-old male c57BL/6 J mice (N = 3, vehicle-injected; N = 3, glucagon-injected). Two-tailed Student’s t tests. a–f All data are presented as mean values ±SEM. Source data are provided as a Source Data file.

