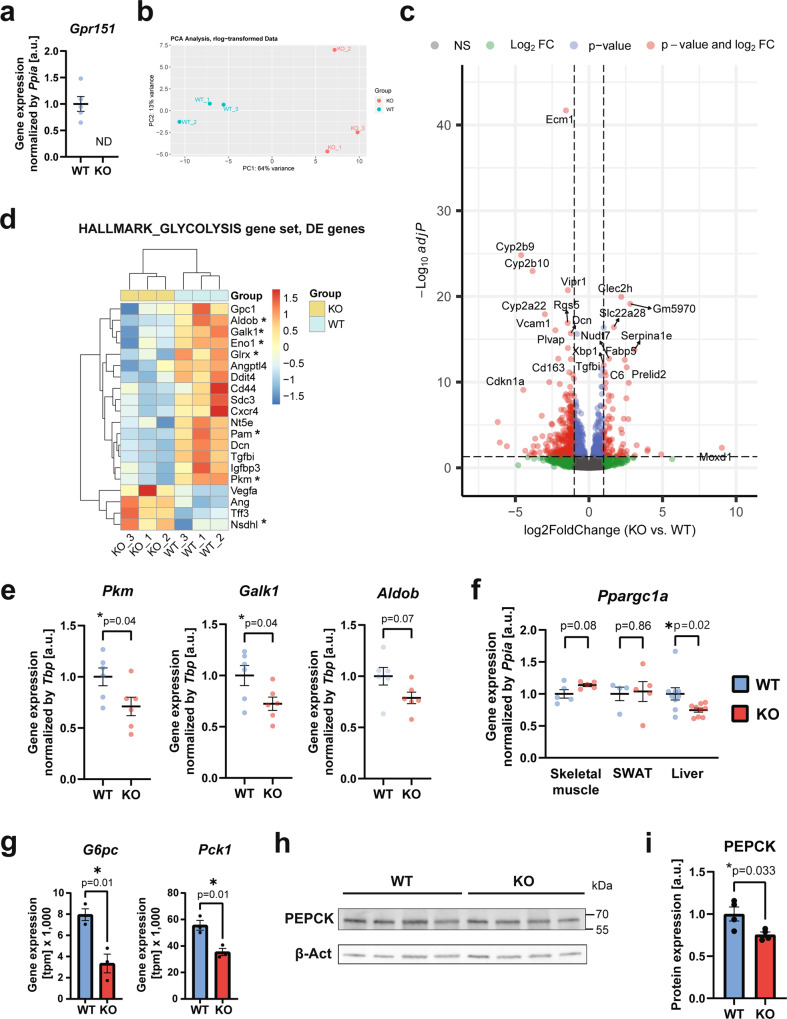
Fig. 3. GPR151 upregulates the expression of hepatic gluconeogenesis genes.
a RT-qPCR quantification of Gpr151 gene expression in the livers of Gpr151 WT and KO mice (N = 5, WT; N = 5, KO). Data are presented as mean values ±SEM. b Principal component analysis showing the clustering of samples analyzed by RNA-Seq. c Volcano plot showing the statistical significance (−log10(padj)) versus log2 of fold change of gene expression between Gpr151 KO and WT livers. d Heat map of transcriptional regulation patterns between DE genes (p-valadj < 0.05) from the glycolysis/gluconeogenesis pathway within the HALLMARK gene sets. Genes which encode enzymes are marked with an asterisk. e RT-qPCR quantification of selected genes from the glycolysis/gluconeogenesis pathway in 16-week-old DIO female mice (N = 6, WT; N = 6, KO). Data are presented as mean values ±SEM. Two-tailed Student’s t tests. f RT-qPCR quantification of Ppargc1a expression in the liver, skeletal muscle and adipose tissue of Gpr151 WT and KO DIO male mice (N = 4, WT; N = 4, KO). Data are presented as mean values ±SEM. Two-tailed Student’s t tests. g Quantification of the expression of PPARGC1A target genes G6pc and Pck1 in Gpr151 WT and KO livers by RNA-Seq. N = 3 mice/group. Data are presented as mean values ±SEM. Two-tailed Student’s t tests (N = 3, WT; N = 3, KO). h Representative Western blotting of PEPCK in the livers of 16-week-old DIO Gpr151 WT and KO male mice. Samples were run on the same blot. Results of one experiment representative for two independent experiments. i Quantification of PEPCK to β-actin in the livers of 16-week-old DIO Gpr151 WT and KO mice (N = 4, WT; N = 4, KO). Average and S.E.M. are indicated. Two-tailed Student’s t test. *p < 0.05. Source data are provided as a Source Data file.

