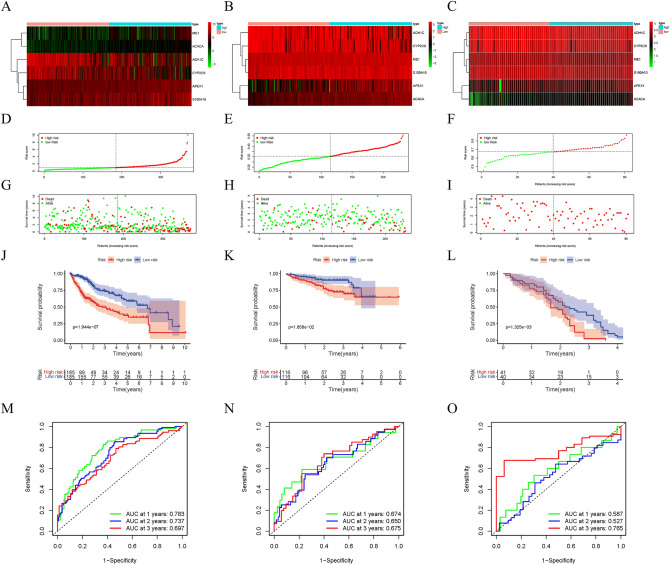
Figure 4.
Verification of the prognostic models. Heat map (using “pheatmap” R package, https://cran.r-project.org/bin/windows/base/old/4.1.3/) of the expression of 6 lipid metabolism related genes in HCC samples in TCGA (A), ICGC (B) and GSE54236 (C). (D–F) Distribution of risk scores for HCC samples in above three datasets. (G–I) The relationship between survival time and status of HCC samples and risk score in above three datasets. (J–L) Kaplan–Meier survival curve of samples in high- and low-risk groups in above three datasets. (M–O) ROC curve of risk score in samples with HCC in above three datasets.

