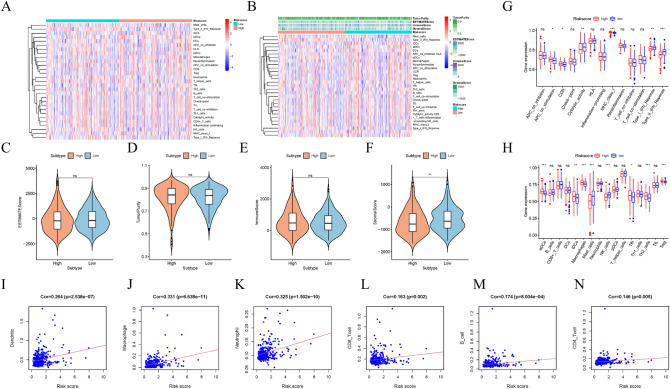
Figure 5.
Risk score is closely related to tumor immune environment characteristics and immune infiltration in HCC. (A,B) Heat map (using “pheatmap” R package, https://cran.r-project.org/bin/windows/base/old/4.1.3/) distribution of risk score and various immune scores. (C–F) Comparison of estimate score, stromal score, immune score, and tumor purity between high-risk groups and low-risk groups. (G) The relationship between immune function and risk score in TCGA cohort. (H) The relationship between immune cell infiltration and risk score in the TCGA cohort. (I–N) Association between this signature and B cells, CD4 + T cells, CD8 + T cells, dendritic cells, macrophages cells and neutrophil cells.

