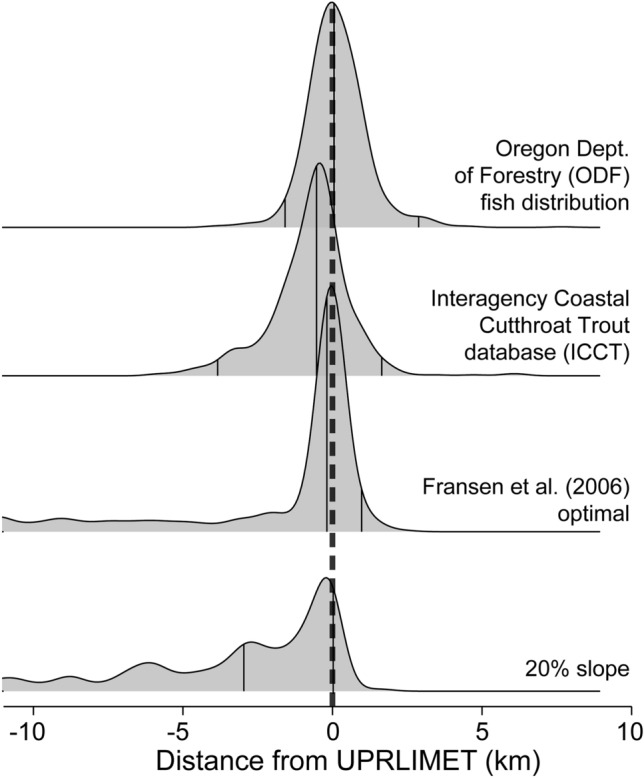
Figure 6.

Ridge plots of frequency distributions of distances to the upper trout limit for UPRLIMET compared to trout occurrence and habitat distributions from Oregon Department of Forestry (ODF), trout occurrence distributions from the Interagency Coastal Cutthroat Trout (ICCT) database, Fransen et al. (2006) optimal model13, and 20% slope cutoff for western Oregon. Positive numbers represent overestimation relative to UPRLIMET and negative numbers are an underestimation. Note that the previously used estimates for upper trout limit by Fransen et al. (2006) optimal13, a 20% slope, and the ICCT database are biased towards underestimation and ODF overestimates. X-axis is distance to UPRLIMET in kilometers, and y-axis is relative frequency.
