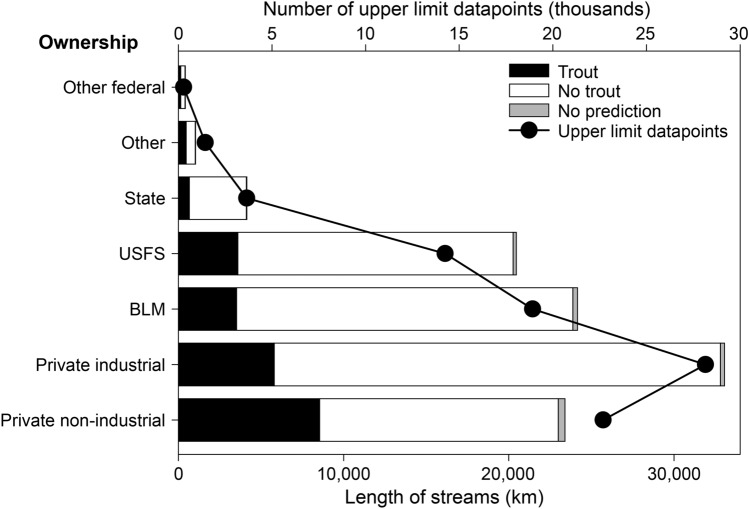
Figure 7.
Distribution of the length of streams (km) with trout, with no trout, and with no predictions, along with the number of upper limit datapoints (thousands) predicted by UPRLIMET across land ownership categories of other federal, other, state, USFS (USDA Forest Service), BLM (Bureau of Land Management), private industrial, and private non-industrial. Stream length was estimated from the HUC12 scale. Note that streams without predictions occur when there is less than 1000 m of stream length over which to evaluate slope, or for channel-initiation reaches where upstream drainage area cannot be calculated.

