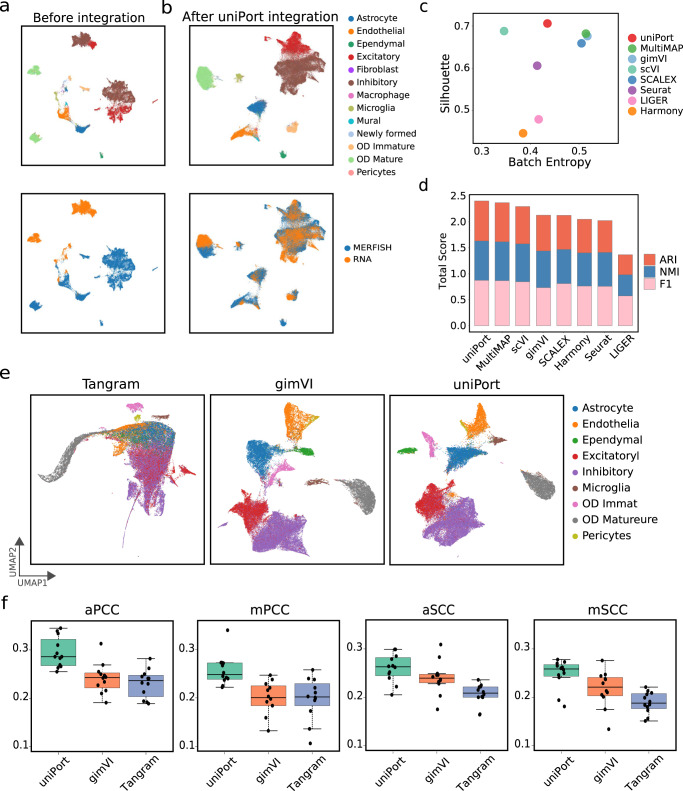
Fig. 5. uniPort imputes MERFISH genes through scRNA data.
a UMAP visualization of MERFISH and scRNA data before integration. b UMAP visualization of MERFISH and scRNA data after uniPort integration. c Comparison of Batch Entropy scores and Silhouette coefficients of different methods. d Comparison of total scores of ARI, NMI and F1 of different methods. e UMAP visualization of imputed MERFISH genes of Tangram, gimVI and uniPort. f Boxplots of average and median Pearson correlation coefficients (aPCC and mPCC) (n = 12, no statistical method was used to predetermine sample size), and average and median Spearman correlation coefficients (aSCC and mSCC) (n = 12) between real and imputed MERFISH genes. In the boxplots, the center line, box limits and whiskers denote the median, upper and lower quartiles and 1.5× interquartile range, respectively.

