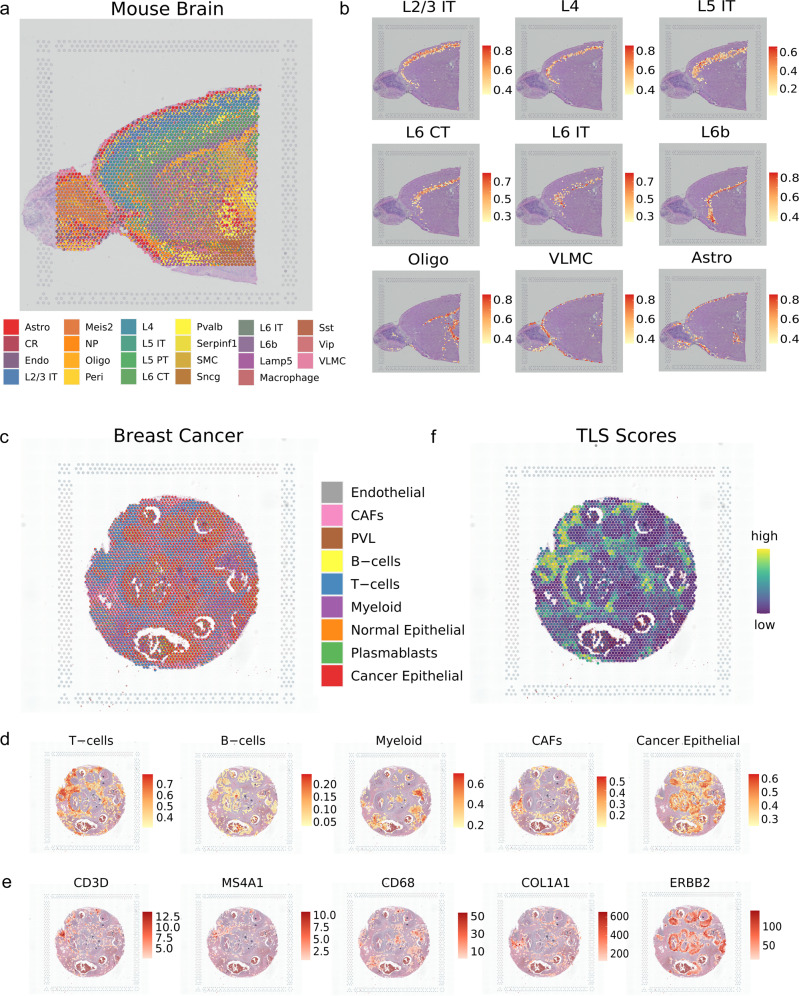
Fig. 6. uniPort identifies iconic structures in spatial transcriptomic data (10× Visium).
a Results of mapping spatial data to single-cell data using the optimal transport plan. Spatial scatter pie plot displays the well-structured cluster composition in adult mouse brain anterior slice. b Lists of canonical cerebral cortical neuron types with scaled proportion. c Spatial deconvolution result of the HER2-positive breast cancer. d Proportion of typical clusters in tumor microenvironment. e Expression of marker genes corresponding to clusters in d. f Tertiary Lymphoid Structure (TLS) scores inferred from summing the proportion of T cells and B cells together with their colocalization.

