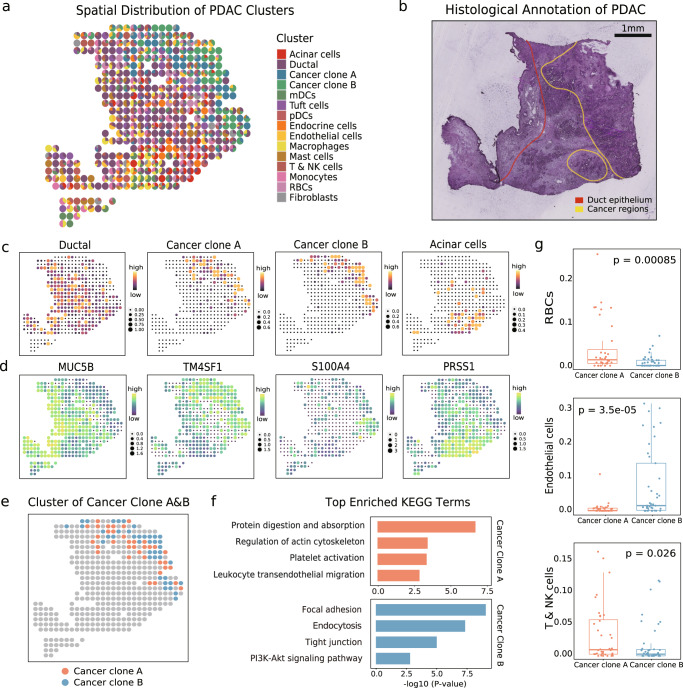
Fig. 7. uniPort identifies distinct cancer subtypes in microarray-based spatial data.
a Spatial deconvolution result of pancreatic ductal adenocarcinoma (PDAC). b Three manually segmented annotation of PDAC tumor cryosection on one ST slide. The red line circles the ductal epithelium region (left), and the yellow line circles the cancer region (right). c Proportion and distribution of typical clusters in PDAC. d Expression of marker genes corresponding to clusters in c. e Distribution of cancer clone subtypes. f Top enriched KEGG terms of distinct cancer subtypes. g Boxplots of significant differences of cluster composition between the cancer clone A (n = 36) and cancer clone B (n = 41) regions (two-sided t-test). In the boxplots, the center line, box limits and whiskers denote the median, upper and lower quartiles and 1.5 × interquartile range, respectively.

