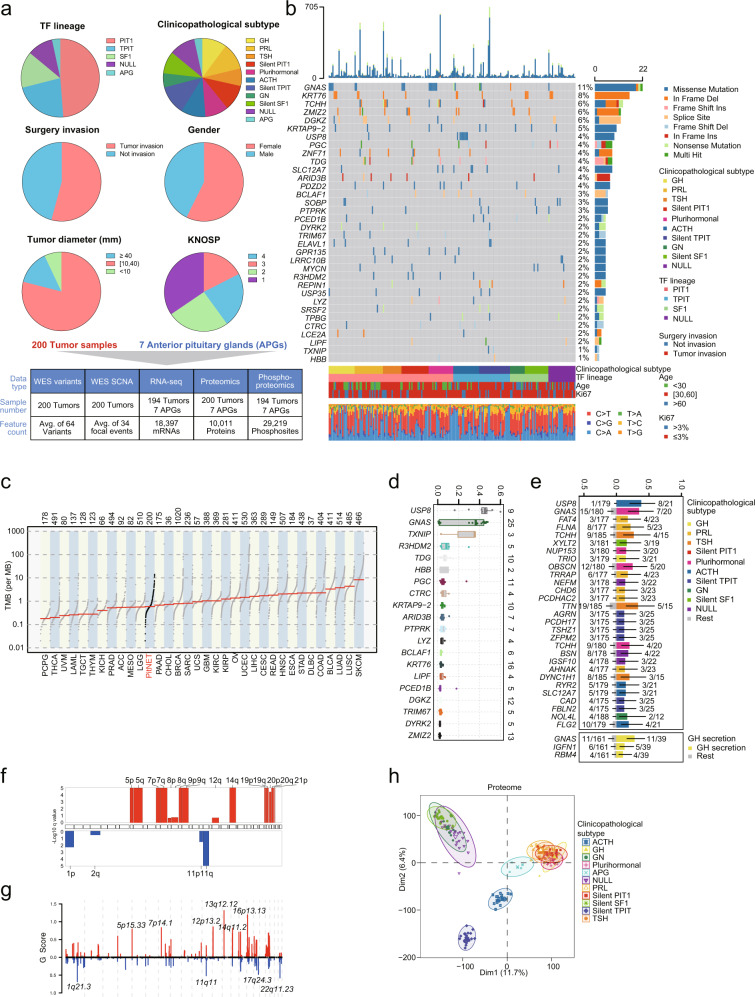
Fig. 1. Proteogenomic landscape of PitNETs.
a Top panel, pie charts of clinical indicators. Bottom panel, sample numbers and multi-omics datasets of the cohort. b Genomic profile and associated clinical features of patients with PitNETs. SMGs in this dataset identified by MutSigCV and OncodriveCLUST (q value < 0.1) are shown. Right panel, percentage of samples affected. Top panel, number of mutations per sample. Middle panel, distribution of significant mutations across sequenced samples, color coded by mutation type. Bottom panel, percentage of somatic base changes per sample. c Comparison of the TMB of our PitNETs cohort and 33 cancer types in TCGA studies. d Boxplot showing the VAF of the top 20 SMGs. e Bar plot showing the genes with significantly different mutation frequencies based on Fisher’s exact test by clinicopathological subtype (Fisher’s exact test, P value < 0.01). The numbers listed on the right side of the barplot represented the mutation frequencies in the indicated clinicopathological subtype tumors. The numbers listed on the left side of the barplot represented the mutation frequencies in the rest tumors. f, g Arm-level and focal-level amplifications and deletions. GISTIC analysis was performed to determine significant regions and genes included in the recurrent CNAs identified in patients with PitNETs. h PCA analysis of proteomics data from 200 PitNETs and 7 APGs based on clinicopathological subtypes.

