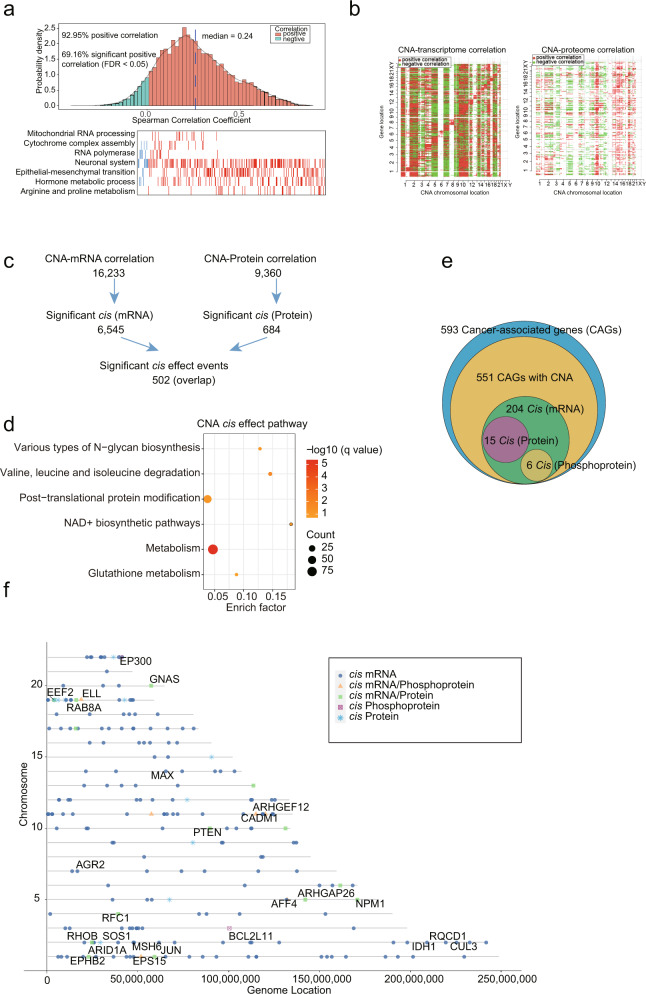
Fig. 2. Impact of CNAs on the transcriptome, proteome and phosphoproteome of PitNETs.
a Gene-wise mRNA-protein Spearman’s correlation in tumors. Red, pathways involving positively correlated genes; blue, pathways involving negatively correlated genes (Spearman’s correlation, FDR < 0.05). b The correlation of CNAs to mRNA (left) or protein abundance (right), with significant positive correlations in red and negative correlations in green (Spearman’s correlation, FDR < 0.05). Genes were sorted by chromosomal location on the x- and y-axes. c Cascading effects of CNAs and the overlap between cis events via the transcriptome and proteome analyses (Spearman’s correlation, FDR < 0.05). d Prioritized cis effect CNA drivers were used for pathway enrichment analysis in ConsensusPathDB. e Venn diagram showing the CAGs with significant CNA cis effects via multi-omics data analyses (Spearman’s correlation, FDR < 0.1). f Genes with cascading copy number cis regulation of their cognate mRNA, protein, and phosphoprotein levels. Shapes indicate the cis effects across the indicated datasets.

