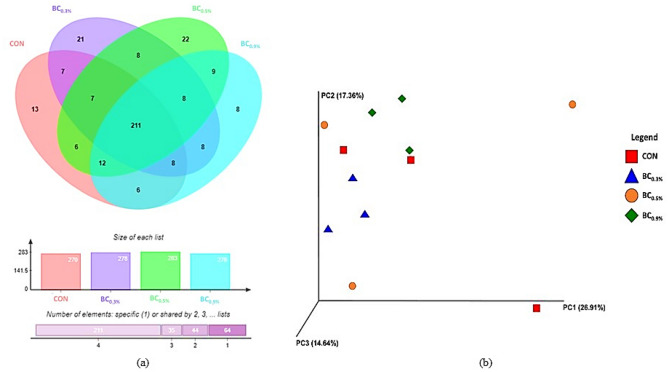
Figure 3.
(a) Membership-based representation of unique, shared and core bacterial community of rumen microbiome after treatment supplementation with varying level of buffering capacity, and the total size of observed species per treatment. Venn diagram was generated in MetaCOMET24 using jvenn26. (b) Principal Coordinate Analysis (PCoA) of all samples using Bray–Curtis distance derived from the subset of identified OTUs. PCoA plot was generated using EMPeror27. CON (no buffer added); BC0.3% (0.3% buffer); BC0.5% (0.5% buffer); BC0.9% (0.9% buffer).

