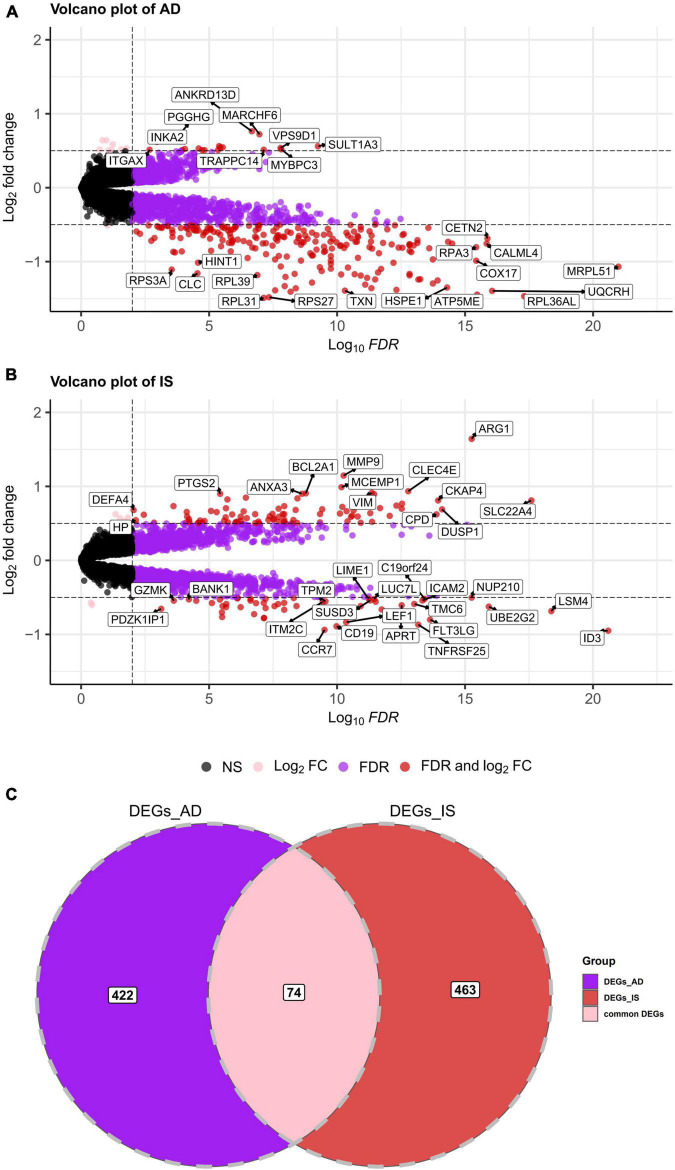
FIGURE 2.
(A,B) Volcano plot demonstrating an overview of the differentially expressed genes in AD and IS. The threshold in the volcano plot was –lg(adjusted P) > 2 and |log2 fold change| > 0.5; red dots indicate significant differentially expressed genes. (C) Venn diagram demonstrates the common DEGs of AD and IS. Red, purple, and pink represent significant DEGs of IS, AD, and both AD and IS, respectively.

