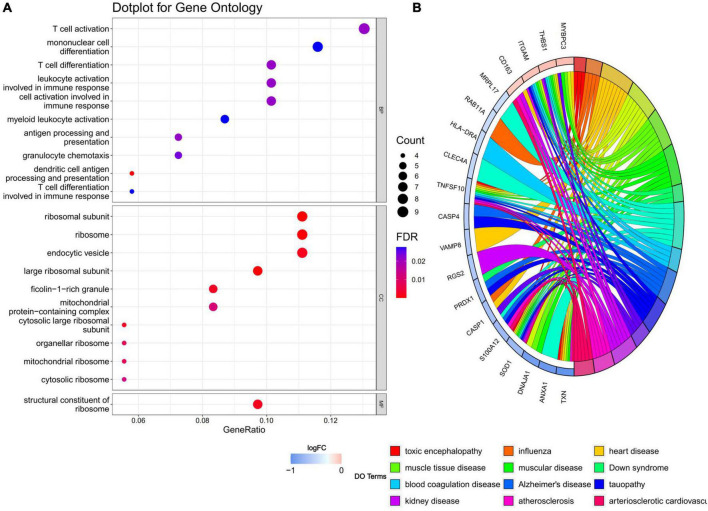
FIGURE 3.
(A) GO enrichment analysis, where the horizontal axis represents the proportion of DEGs under the GO term. Top 10 pathways with most significant P-value were shown and ordered by gene ratio. BP, biological process; CC, cellular component; MF, molecular function. (B) DO enrichment analysis. Chord diagram showed the correlation between diseases and common DEGs, with different colors corresponding to different DO terms.

