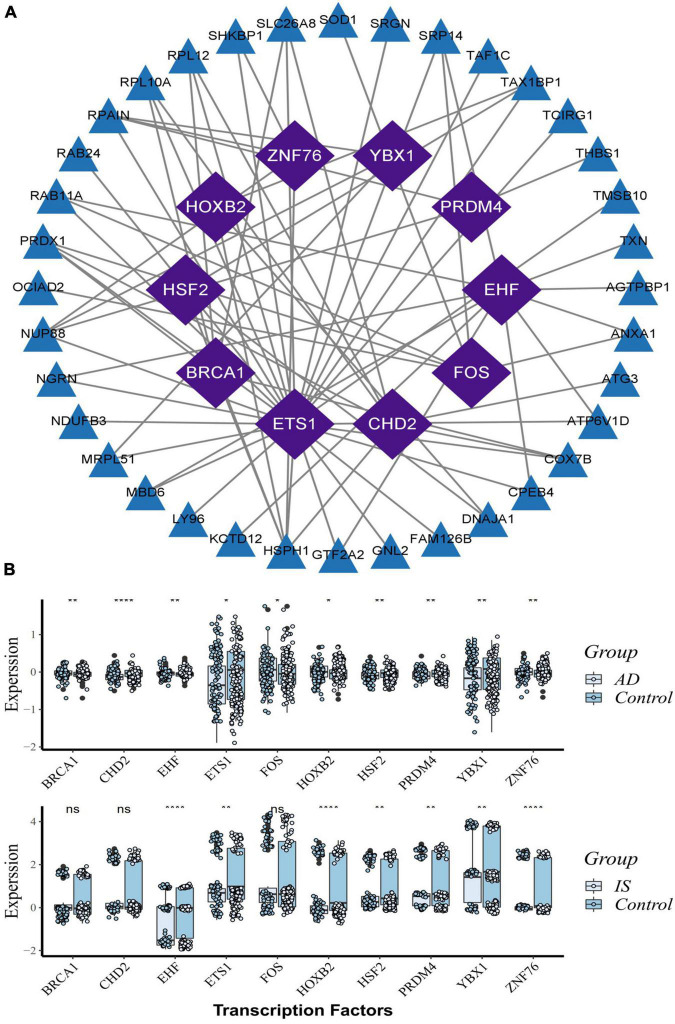
FIGURE 6.
Transcription factors (TFs) regulatory network and their gene expression profiles in AD/IS. (A) TFs regulatory network. TFs were marked in purple, and the hub genes were marked in blue. (B) The gene expression level of TFs in AD and IS datasets. The comparison of gene expression between patients and controls was applied with t-test. P-value < 0.05 was considered statistically significant. AD, Alzheimer’s disease; IS, ischemic stroke. *P < 0.05; **P < 0.01; ****P < 0.0001.

