
FIGURE 3.
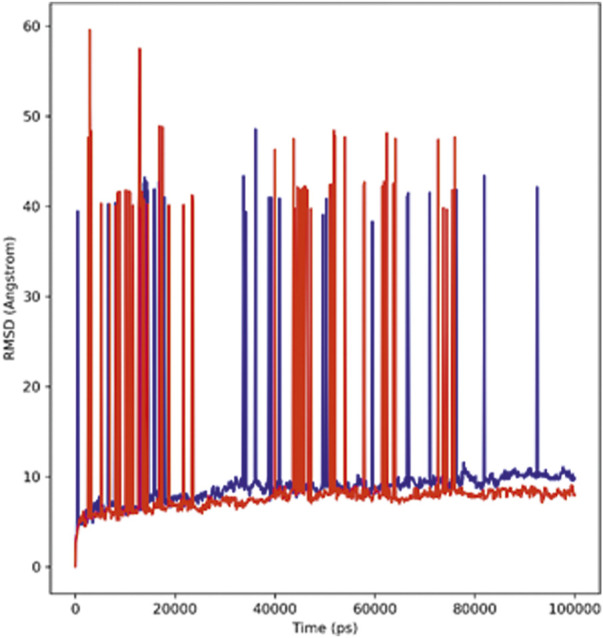
RMSD profiles of the hTERT–adapalene complex (red) and the hTERT–tamsulosin complex (blue) for 100 ns of MD simulation.
Official websites use .gov
A
.gov website belongs to an official
government organization in the United States.
Secure .gov websites use HTTPS
A lock (
) or https:// means you've safely
connected to the .gov website. Share sensitive
information only on official, secure websites.
RMSD profiles of the hTERT–adapalene complex (red) and the hTERT–tamsulosin complex (blue) for 100 ns of MD simulation.