FIGURE 8.

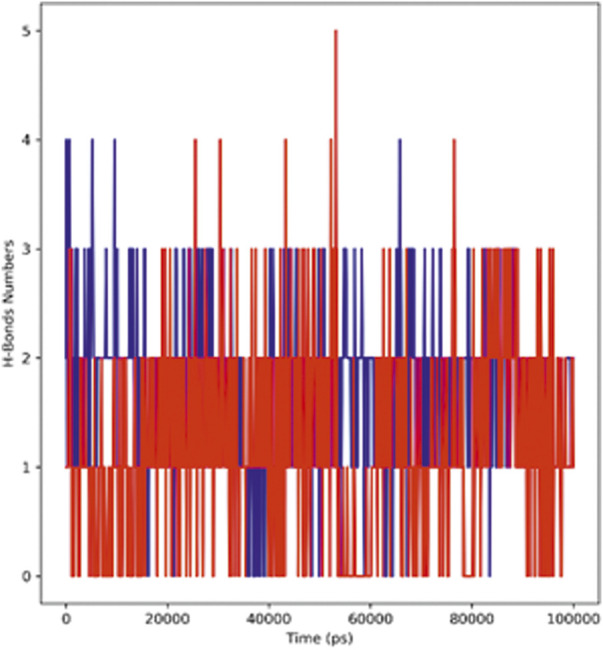
Representation of the hydrogen bonding pattern observed for protein–ligand complexes (adapalene–red and tamsulosin–blue) for 100-ns MD simulation.

Representation of the hydrogen bonding pattern observed for protein–ligand complexes (adapalene–red and tamsulosin–blue) for 100-ns MD simulation.