
Figure 4.
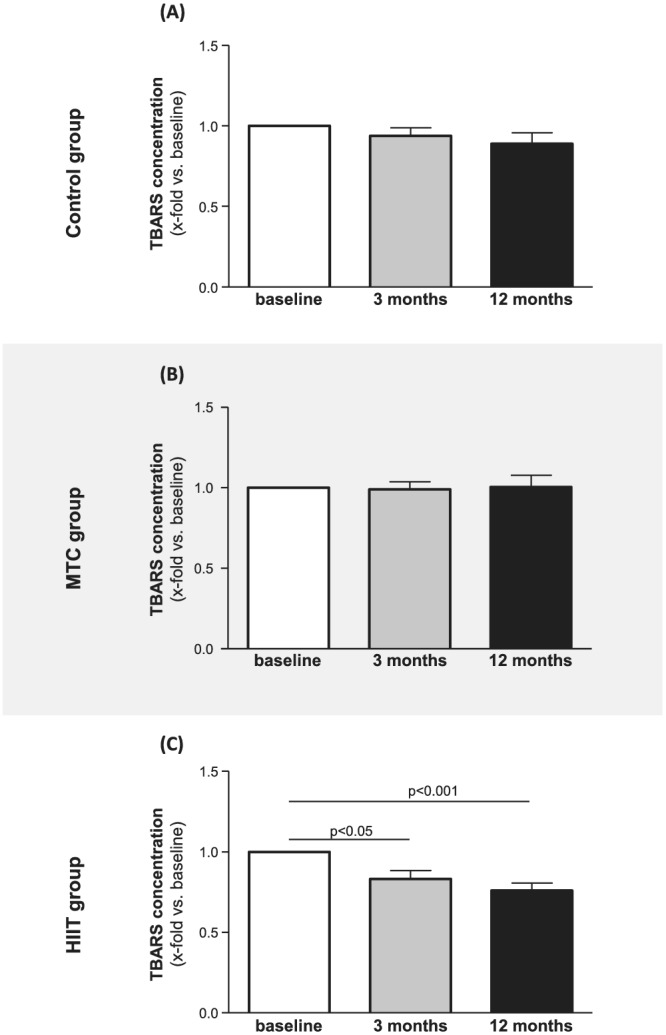
TBARS concentration was quantified at baseline (white bars), 3 months (grey bars), and 12 months (black bars) in serum samples from the control group (A), the MCT group (B), and the HIIT group (C). Values are shown as x‐fold increase vs. baseline and expressed as means ± SEM.