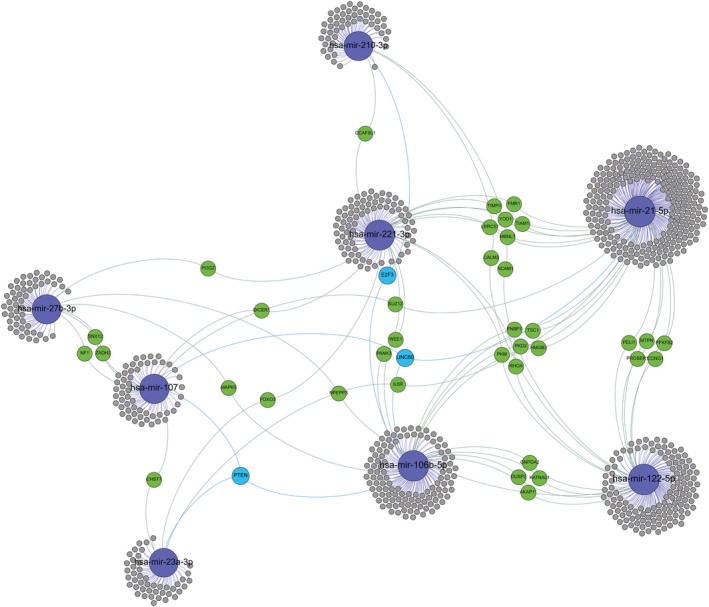
Figure 3.

Target gene networks of microRNAs that exhibited prognostic capabilities. Only microRNAs that displayed independent association with outcome events are shown, highlighted in blue. Genes with at least two potential interactions are labelled. Genes with just one connection are unlabelled. Colour nodes of regulated genes are proportional to node degree (number of connections).
