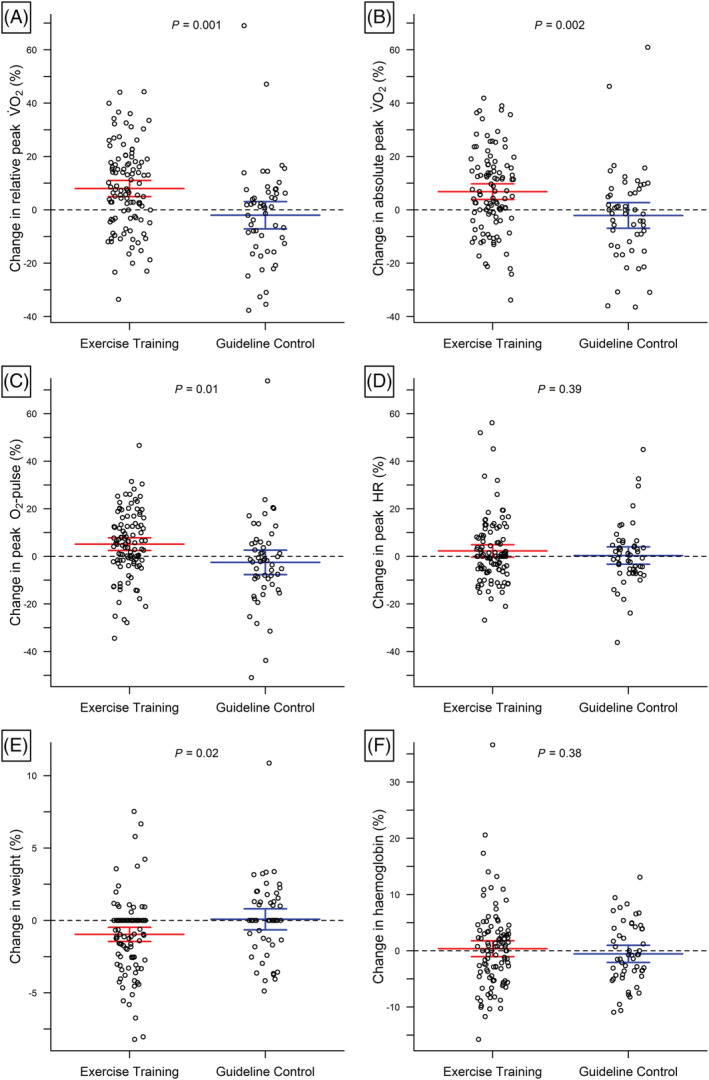
Figure 2.

Change in relative peak V̇O2 and its determinants. Differences in individual changes (circles) plus mean and 95% confidence intervals (lines) of relative peak V̇O2 (A), absolute peak V̇O2 (B), O2‐pulse (C), peak heart rate (D), weight (E) and haemoglobin (F) between exercise training and guideline control.
