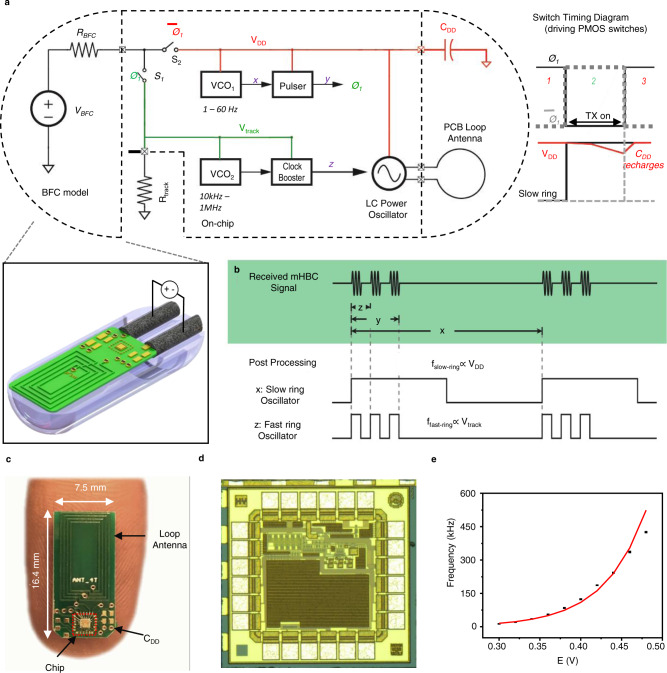
Fig. 2. Electrical characterization of the custom integrated circuit.
a Schematic and operational diagram of the circuit. b Timing diagram illustrating pulsed, duty-cycled nature of the circuit, where mHBC pulses of duration z occur over a time period y, which is a small fraction of the overall inter-transmission interval, x. c Picture of the prototype electronic board on a human finger. d Die microphotograph of the developed chip. e Calibration curve of potential to mHBC signal frequency. Data are presented as mean values +/− SD. Error bars represent the standard deviation between multiple circuit boards tested., n = 4 independent circuit boards were tested.

