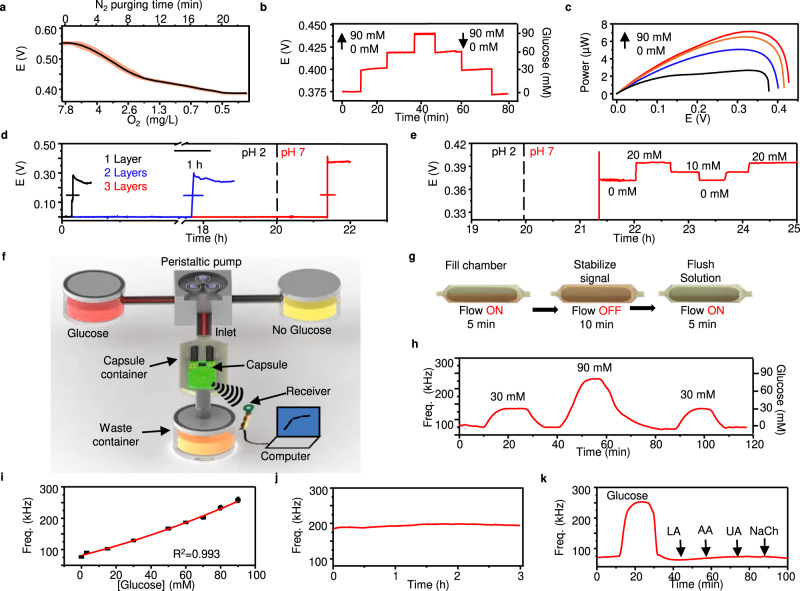
Fig. 3. In vitro characterization and simulation of the glucose BFC under close-to-real physiological conditions inside the GI.
a Measurement of the BFC potential under 200 kΩ load with 30 mM glucose at different O2 concentrations during different N2 purging times. The red shaded area represents the inter-sample fluctuations, n = 4 independent experiments were performed. b BFC voltage response under 200 kΩ load toward ascending the descending glucose concentrations (0, 30, 60, and 90 mM). c Power of BFC under different glucose concentrations characterized via linear sweep voltammetry. Scan rate, 5 mV s−1. d pH-sensitive enteric coating optimization with 1,2, and 3 layers of Eudragit® L100 coating in acidic artificial gastric fluid for 20 h followed by neutral artificial intestinal fluid. Data are presented as mean values +/− SD. Horizontal error bars represent inter-sample variations, n = 3 independent experiments were performed. e Potential of the BFC sensor under load with 3 layers of the enteric coating after activation in response to alternating glucose concentrations (0, 10, and 20 mM). f Illustration of the in vitro simulation fluidic system setup. g Operating procedure of the fluidic system. h Frequency response to alternating glucose concentrations (0, 30, and 90 mM). i Calibration curve of glucose concentration to mHBC signal frequency. Data are presented as mean values +/− SD. Error bars represent the standard deviation, n = 3 independent experiments were performed. j Stability test performed for 3 h in artificial intestinal fluid with 60 mM glucose. k Sensor interference test, performed by serial injection of artificial intestinal fluid containing 0 mM glucose, 90 mM glucose, 0.1 mM LA, 0.1 mM AA, 0.1 mM UA, and 3 mM NaCh.

