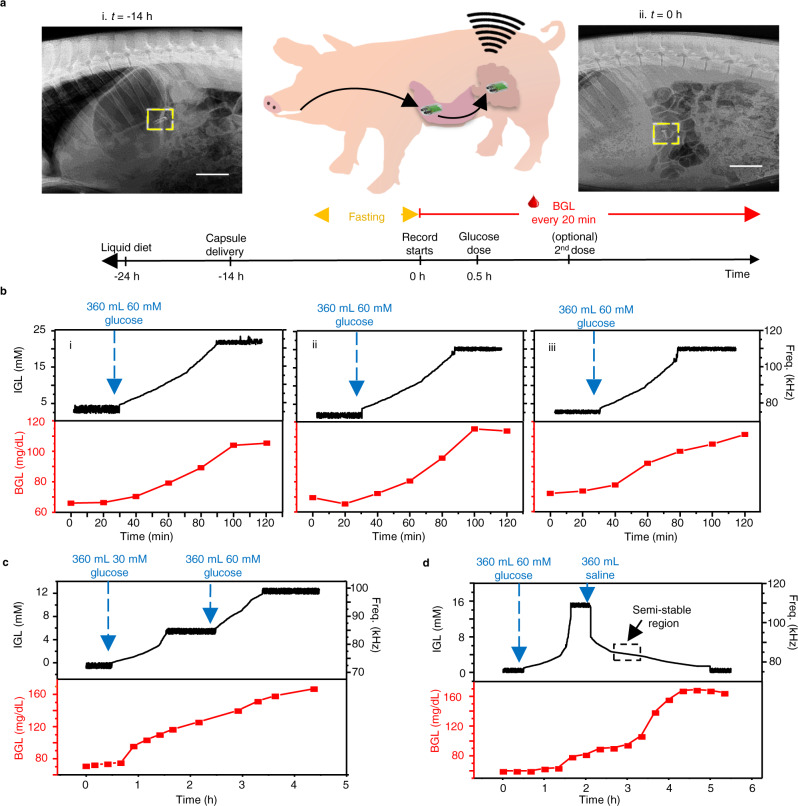
Fig. 4. Capsule in situ performance in a porcine model.
a X-rays images of the pig after oral delivery of the capsule (top) at t = −14 h (i) and t = 0 h (ii), and the timeline of the experiment protocol (bottom). Scale bar, 5 cm. b IGL and BGL monitoring after delivering a 360 mL of 60 mM glucose saline dosage (t = 30 min) in 3 independent in situ experiments (i–iii). c In situ experiment tracking the IGL and BGL during the sequential delivery of a 360 mL 30 mM glucose saline dosage (t = 30 min) followed by a 360 mL 60 mM glucose saline dosage (t = 150 min). d In situ experiment tracking the IGL and BGL during the sequential delivery of a 360 mL 60 mM glucose saline dosage (t = 30 min) followed by a 360 mL glucose-free saline dosage (t = 120 min).

