Figure 1.
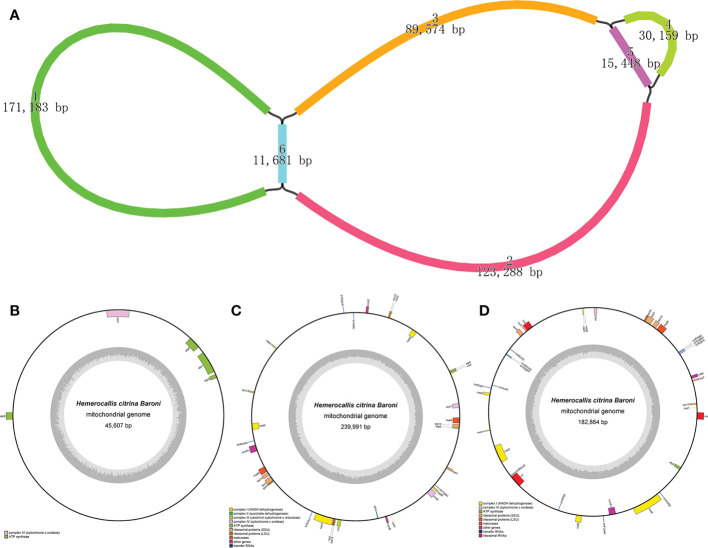
Assembly results of the H. citrina mitogenome. (A) The assembly graph of the H. citrina mitogenome. Each colored segment is labeled with its size and named 1-6 by rank of size. (B-D) Circular map of the H. citrina mitogenome. Genes presented on the outer circle are transcribed, whereas genes on the inside are counterclockwise. The inner circle reveals the GC content as a dark gray plot with the gray line in the middle as the 50% threshold line. (B) Schematic diagram of molecule 1 with a length of 45,607 bp and five annotated genes; (C, D) Similar maps for molecule 2 and molecule 3 with lengths of 239,991 bp and 182,864 bp, respectively. Because the three genes (nad1, nad2, and nad5) encoding the subunits of Complex I (NADH dehydrogenase) are fragmented in molecules 2 and 3, the two mt circular molecules encode a total of 61 genes.

