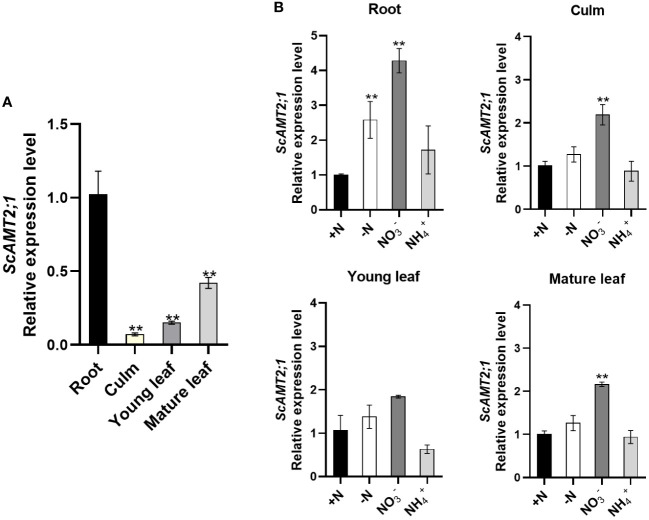
Figure 2.
Expression of ScAMT2;1 in sugarcane organs after subjecting plants to distinct inorganic N sources or no N. (A) RT–qPCR analysis of ScAMT2;1 expression in roots, culms, and young (+1) or mature (+3) leaves of sugarcane grown under 2 mM NH4NO3 for 2 d. Bars indicate ± SE (n = 3). ScUBQ2 was adopted as a reference gene. Gene expression levels were normalized to expression levels in culms. Asterisks represent significant differences in relation to culms according to Student’s t test (p < 0.01). (B) ScAMT2;1 relative expression levels in sugarcane roots, culm, young, and mature leaves of plants under +N: 2 mM NH4NO3, -N: no N; : 4 mM KNO3, or NH4 +: 4 mM NH4Cl for 14 d. ScUBQ2 was used as a reference gene. The gene expression level was normalized to the +N treatment. Bars indicate ± SE (n = 3). Asterisks represent significant differences between treatments and +N according to Student’s t test (p < 0.01).

