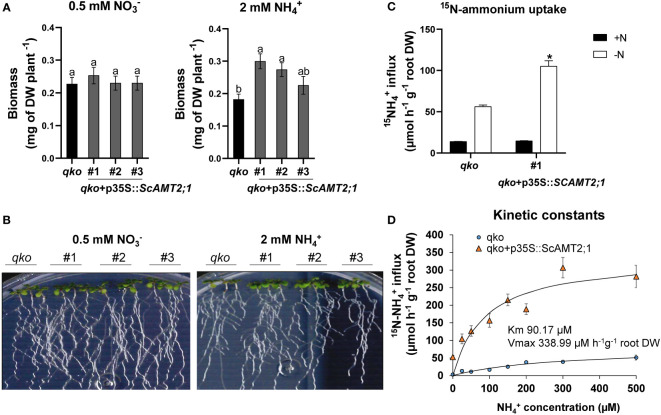
Figure 4.
Functional evaluation of complemented Arabidopsis qko mutant. (A) Total biomass (DW, dry weight) of homozygous lines of Arabidopsis overexpressing ScAMT2;1 (qko+p35S::ScAMT2;1) subjected to either 0.5 mM KNO3 () or 2 mM NH4Cl (NH4 +) for 14 d. Bars indicate means ± SE (n = 6). Different letters indicate significant differences among means according to Tukey’s test (p ≤ 0.05). (B) Phenotype of qko and transgenic events grown in vitro under different N sources. (C) Influx of 15N-labeled ammonium into the roots of qko and a transgenic line (#1) overexpressing ScAMT2;1 subjected to either N-free (-N) or 0.2 mM NH4 + (+N) nutrient solution for 3 d. Bars indicate means ± SE (n = 4). Asterisks indicate significant differences between qko and the transgenic line according to Student’s t test (p < 0.05). (D) Concentration-dependent influx of 15NH4 + into roots of qko or qko+p35S::ScAMT2;1 (#1). Symbols indicate six biological replicates (n = 6).

