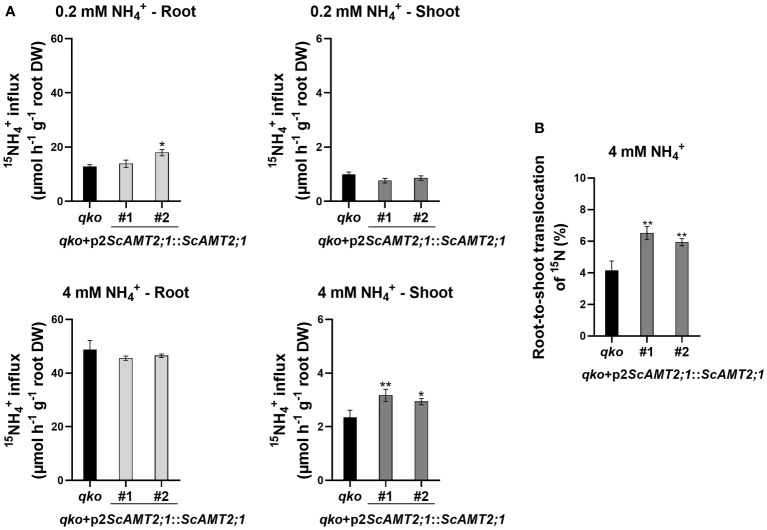
Figure 7.
15N accumulation in roots and shoots of qko and complemented qko transgenic lines expressing ScAMT2;1 under the regulation of its sugarcane endogenous promoter (p2). The assay was performed in plants after 3 d of exposure to an N-free nutrient solution, followed by 1 h of treatment in either a 0.2 mM or 4.0 mM 15NH4 + solution. Bars indicate means ± SE (n = 5). Asterisks indicate significant differences in root and shoot 15NH4 + accumulation between qko and transgenic plants according to Student’s t test (*p < 0.1 and **p < 0.05). (B) Root-to-shoot translocation of 15N in percent of 15N accumulation in shoots in relation to the whole plant. Asterisks indicate significant differences between qko and transgenic plants according to Student’s t test (** p < 0.05).

