


Figure 2.
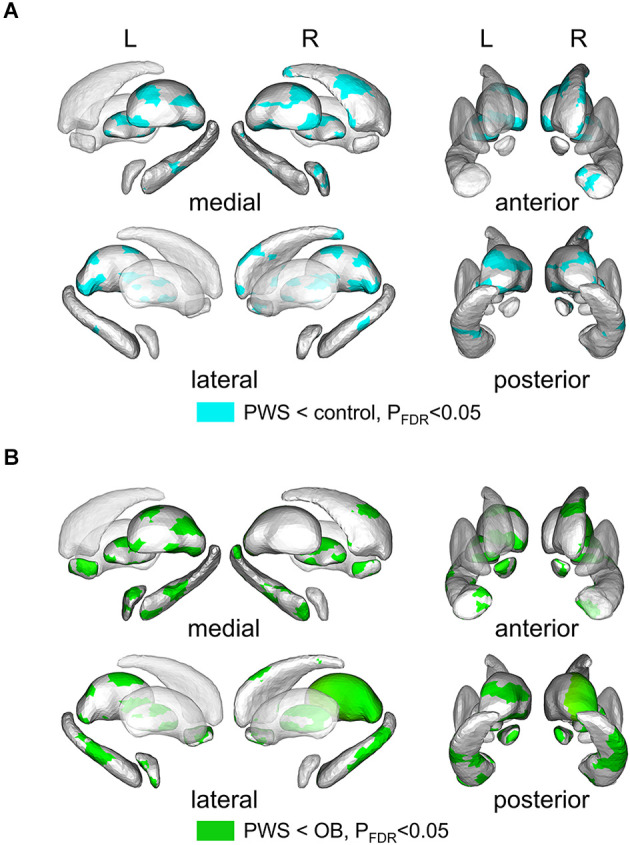
Results of shape analysis in cerebral nuclei, shown from medial, lateral, anterior, and posterior views. (A) Atrophic subregions (cyan color) of PWS compared with the control. (B) Atrophic subregions (green color) of PWS compared with OB. PWS, children with Prader-Willi Syndrome; OB, obese children without PWS.