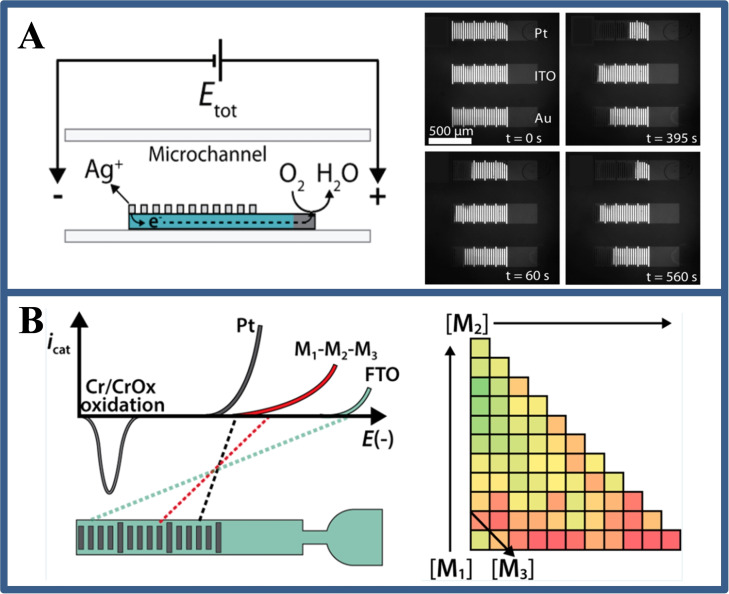
Figure 3.
(A) Schematic illustration of electrocatalyst candidates based on the electrocatalytic effect of microscale bipolar electrode array, and the optical micrograph of electrode before and after applying voltage at different times. Reproduced with permission from Ref. [17]. Copyright 2012, American Chemical Society; (B) Schematic of the relationship between the voltages required to drive both Cr electrooxidation and the HER, and the matrix plot showing the number of dissolved Cr bands in bimetallic and trimetallic catalysts as a function of composition. Reproduced with permission from Ref. [18]. Copyright 2014, American Chemical Society.

