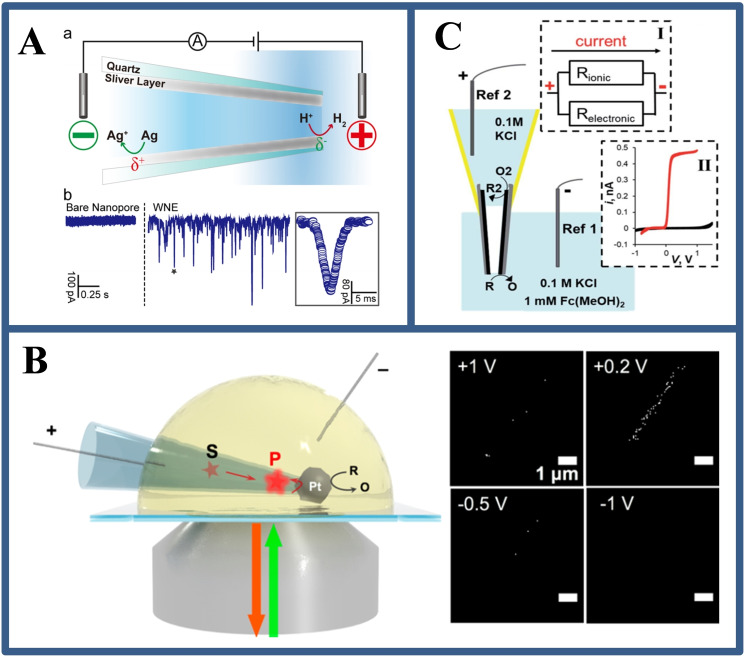
Figure 9.
(A) Illustration of H2 and Ag+ BPE sensing by a WNE at the single molecules level and the raw current traces of the bare nanopore and the WNE. Reproduced with permission from Ref. [52]. Copyright 2017, American Chemical Society; (B) Schematic illustration of the Pt‐based nanocell used to image single resorufin molecules and the imaging for single fluorescent molecule locations at different potentials. Reproduced with permission from Ref. [53]. Copyright 2018, American Chemical Society; (C) Schematic representation, equivalent scheme and cyclic voltammograms of the carbon layer based bipolar nanoelectrode. Reproduced with permission from Ref. [54]. Copyright 2014, American Chemical Society.

