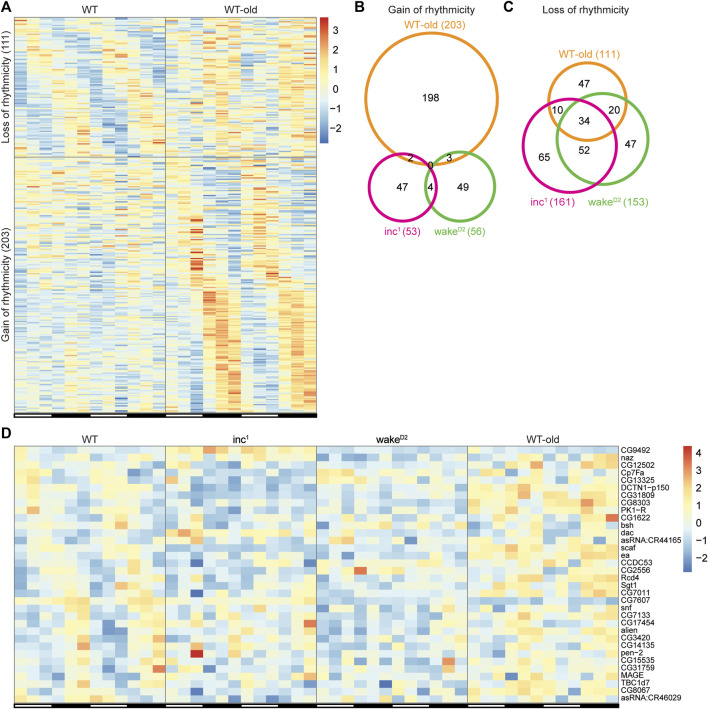
FIGURE 6.
Shared rhythmicity changes across chronically sleep deprived flies and old flies. (A) Genes with rhythmicity change in WT-old. Each row represents one gene, and each column represents one timepoint. Expression levels are normalized to each gene itself and data are aligned according to the peak expression time in the highly rhythmic group calculated by JTK cycle. The blocked horizontal bars below the panel correspond to the light-dark cycle. (B,C) Intersection of gain of rhythmicity genes (B) and loss of rhythmicity genes (C) in inc 1 (magenta), wake D2 (green), and WT-old (orange). (D) Heatmap of the 34 intersected genes in (C). Each row represents one gene, and each column represents one timepoint. Expression levels are normalized to each gene itself and data are aligned according to the peak expression time in WT group calculated by JTK cycle. The blocked horizontal bars below the panel correspond to the light-dark cycle.

