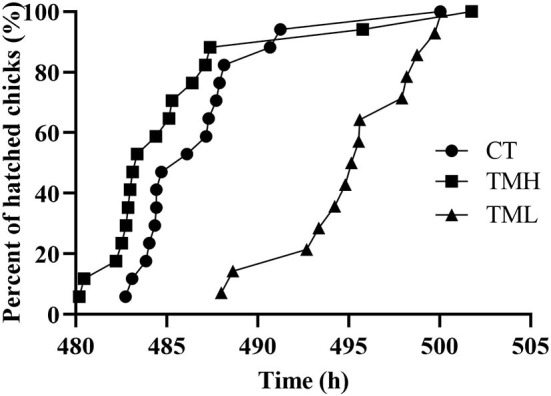
Figure 3.

Distribution of hatch after exposure to control temperature (CT, 37.6°C) and thermal manipulation with high temperature (TMH, 39°C, 8 h/day) or low temperature (TML, 20°C, 1 h/day) from embryonic day (ED) 8 to ED 15. The Y axis is percent of hatched birds and the X axis is the incubation duration.
