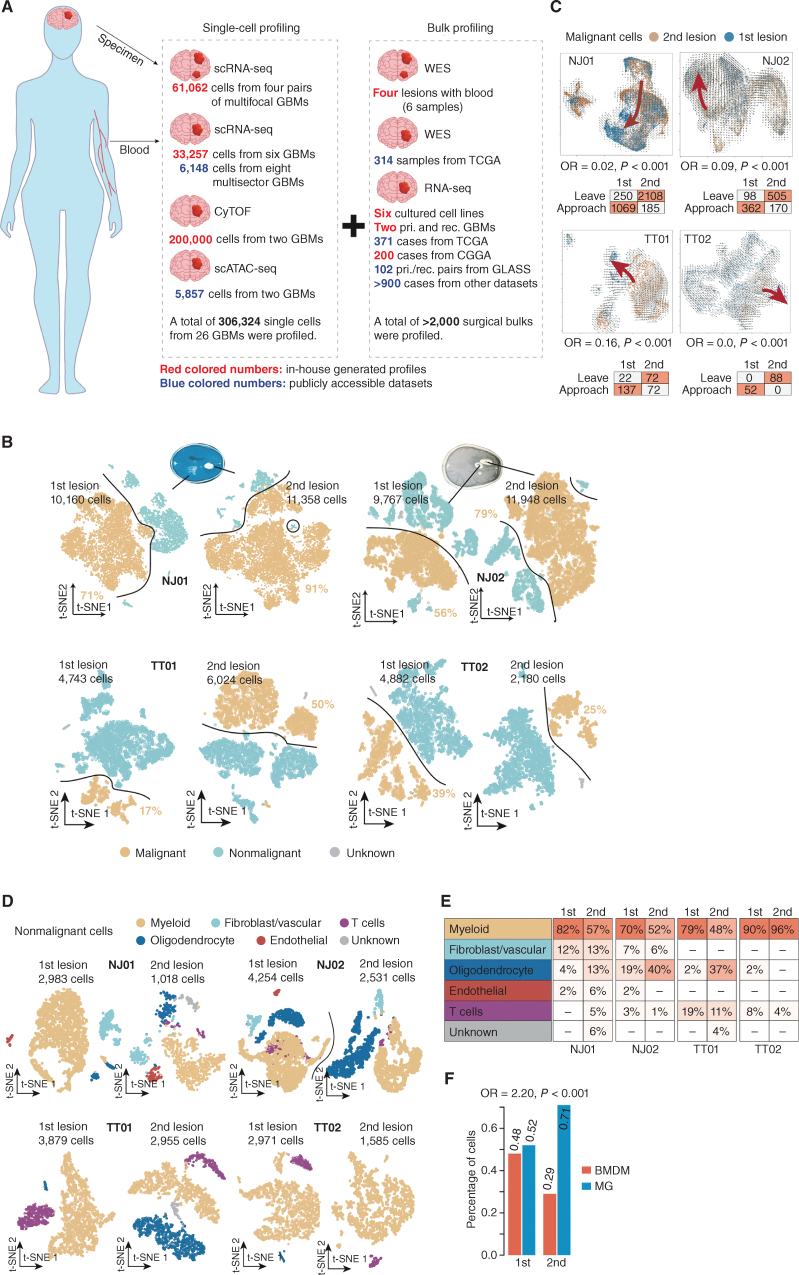
Figure 1.
Comparative characterization of multifocal GBMs and the TME by scRNA-seq. A, Schematic workflow for the construction of single-cell multifocal GBM transcriptomes. CGGA, Chinese Glioma Genome Atlas; cyTOF, cytometry by time of flight; pri., primary; rec., recurrent; scATAC-seq, single-cell sequencing assay for transposase-accessible chromatin; TCGA, The Cancer Genome Atlas; WES, whole-exome sequencing. B, T-distributed stochastic neighbor embedding (t-SNE) plots of malignant (orange dots) and nonmalignant (blue dots) cells in the first and second lesions derived from the indicated cases. C, Top, RNA velocity illustrates the direction of tumor cell transition in the t-SNE plots between two lesions across the indicated cases. Bottom, the table shows the number of cells with a putative transition tendency to the center of each lesion. OR, odds ratio.D, t-SNE plot of nonmalignant cells in the first and second lesions derived from the indicated cases. E, Comparison of the percentages of different nonmalignant cell types between the first and second lesions across the indicated cases. F, Comparison of percentages of cells identified as BMDMs and MGs in the first and second lesions across the four cases (NJ01, NJ02, TT01, and TT02).

