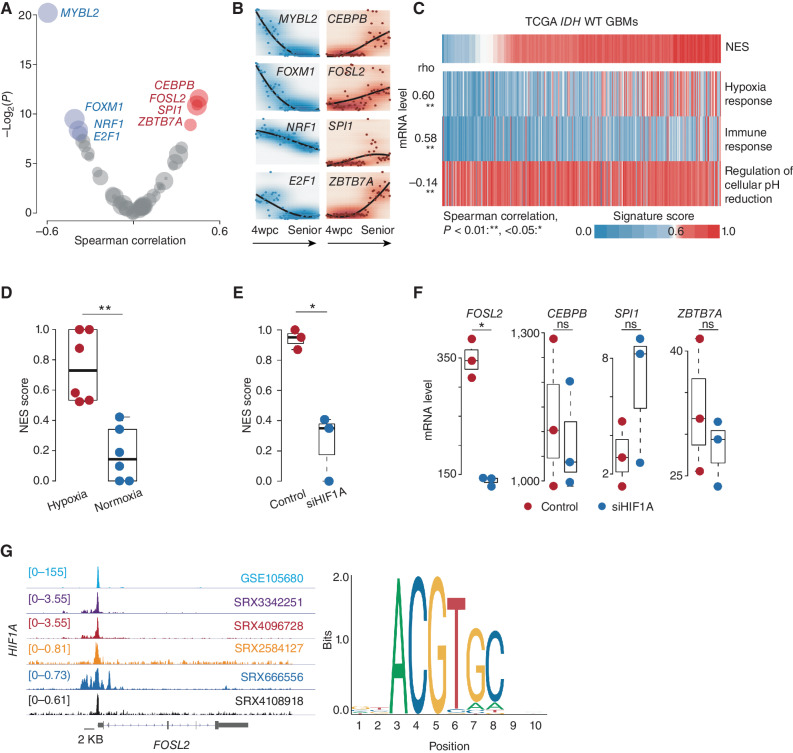
Figure 3.
Microenvironment remodeling is associated with NES transition. A, Scatter plot of the Spearman correlation between NES score and regulatory activity across TCGA IDH wild-type GBMs. The x-axis and y-axis represent the correlation coefficient (rho) and log-transformed P value, respectively. TFs whose regulatory activity is positively and negatively correlated (adjusted P < 0.2) with NES score (red and blue, respectively). B, mRNA expression of indicated TFs across different stages of brain development from 4 weeks post-conception (wpc) to advanced age. C, Correlation between the NES and indicated pathways across TCGA IDH wild-type (WT) GBMs. Spearman correlation; **, P < 0.01; *, <0.05. D, Comparison of NES scores between tumor cells under hypoxic and normoxic conditions. Wilcoxon rank-sum test; **, P < 0.01; *, <0.05 (P values here also apply to E and F). E, Comparison of NES scores between tumor cells in the indicated groups. F, Comparison of the mRNA level of the indicated gene between tumor cells in the indicated groups. ns, not significant. G, Left, ChIP-seq analysis of HIF1A across various cancer types. The representative Integrative Genomics Viewer tracks at the FOSL2 locus show the distribution of peaks upstream of the transcription start site (<5 KB). Right, binding motif of HIF1A (from JASPAR).

