. 2022 Sep 19;12(12):2820–2837. doi: 10.1158/2159-8290.CD-22-0196

Figure 4.

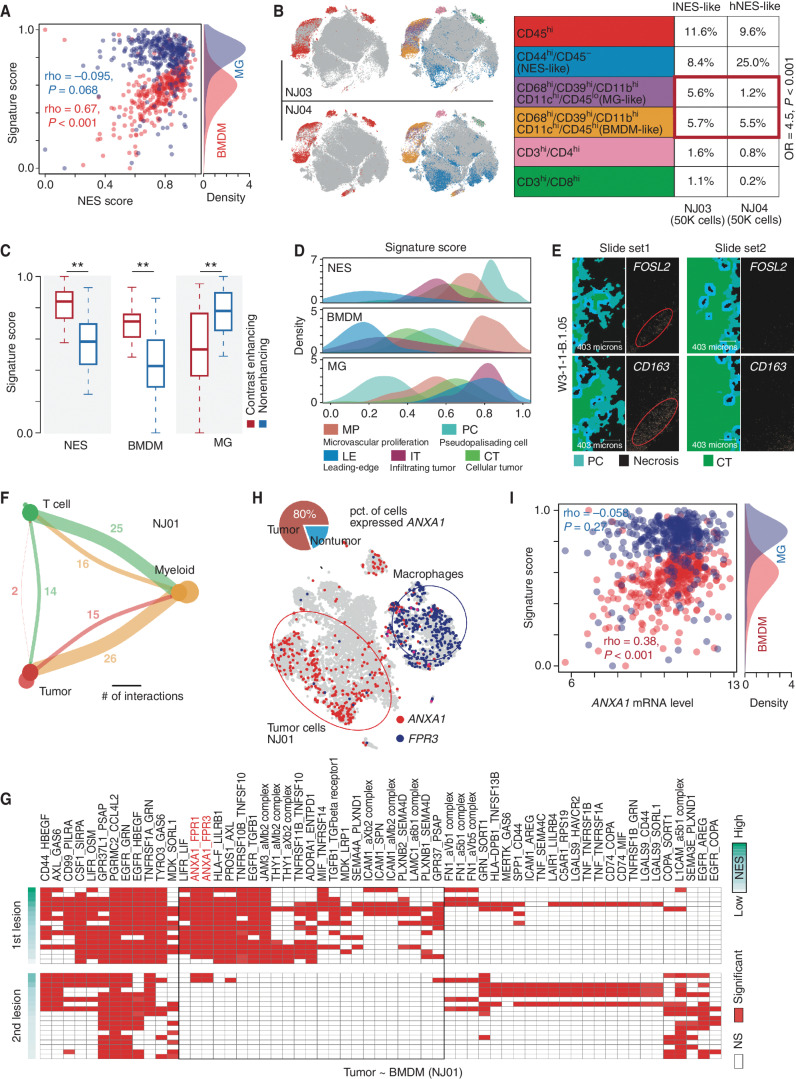
Figure 4. Associations between NES and immune microenvironment. A, Correlation between NES score (x-axis) and signature scores (y-axis) of MGs (blue points) and BMDMs (red points) in TCGA IDH wild-type GBMs. The density plot on the right represents the distribution of MG and BMDM signature scores. B, Left, distribution of CD45 overlaid on the 2D t-distributed stochastic neighbor embedding (t-SNE) plot of the GBM sample derived from NJ03 (top) and NJ04 (bottom) patients. Distribution of combination of gene markers overlaid on the 2D t-SNE plot of GBM samples derived from NJ03 (top) and NJ04 (bottom) patients. Right, comparison of percentages of indicated cell types between two samples (NJ03 and NJ04). OR, odds ratio. C, Comparison of indicated signature scores between samples in contrast-enhancing and nonenhancing regions. Wilcoxon rank-sum test; **, P < 0.01. D, The distribution of indicated signatures (top: NES; middle: BMDM; bottom: MG) among different GBM regions. E, Image of in situ hybridization and tumor feature annotation (derived from IVY GAP, W3-1-1-B.1.05) for FOSL2 and CD163 expression among different regions (top: PC; bottom: CT). F, Interaction among different cell types. The width of links represents the number of significant ligand–receptor interactions between the indicated cell types. G, A heat map for ligand–receptor interactions between indicated cell types across the first and second lesions of NJ01. NS, not significant. H, Distribution of the indicated genes (ANXA1 and FPR3) overlaid on the 2D t-SNE plot of the first lesion of NJ01. The pie plot demonstrates the percentage of the indicated cells highly expressing ANXA1. I, Correlation between ANXA1 mRNA expression (x-axis) and MG (blue) and BMDM (red) signature scores across TCGA IDH wild-type GBMs.

Associations between NES and immune microenvironment. A, Correlation between NES score (x-axis) and signature scores (y-axis) of MGs (blue points) and BMDMs (red points) in TCGA IDH wild-type GBMs. The density plot on the right represents the distribution of MG and BMDM signature scores. B, Left, distribution of CD45 overlaid on the 2D t-distributed stochastic neighbor embedding (t-SNE) plot of the GBM sample derived from NJ03 (top) and NJ04 (bottom) patients. Distribution of combination of gene markers overlaid on the 2D t-SNE plot of GBM samples derived from NJ03 (top) and NJ04 (bottom) patients. Right, comparison of percentages of indicated cell types between two samples (NJ03 and NJ04). OR, odds ratio. C, Comparison of indicated signature scores between samples in contrast-enhancing and nonenhancing regions. Wilcoxon rank-sum test; **, P < 0.01. D, The distribution of indicated signatures (top: NES; middle: BMDM; bottom: MG) among different GBM regions. E, Image of in situ hybridization and tumor feature annotation (derived from IVY GAP, W3-1-1-B.1.05) for FOSL2 and CD163 expression among different regions (top: PC; bottom: CT). F, Interaction among different cell types. The width of links represents the number of significant ligand–receptor interactions between the indicated cell types. G, A heat map for ligand–receptor interactions between indicated cell types across the first and second lesions of NJ01. NS, not significant. H, Distribution of the indicated genes (ANXA1 and FPR3) overlaid on the 2D t-SNE plot of the first lesion of NJ01. The pie plot demonstrates the percentage of the indicated cells highly expressing ANXA1. I, Correlation between ANXA1 mRNA expression (x-axis) and MG (blue) and BMDM (red) signature scores across TCGA IDH wild-type GBMs.