Figure 5.
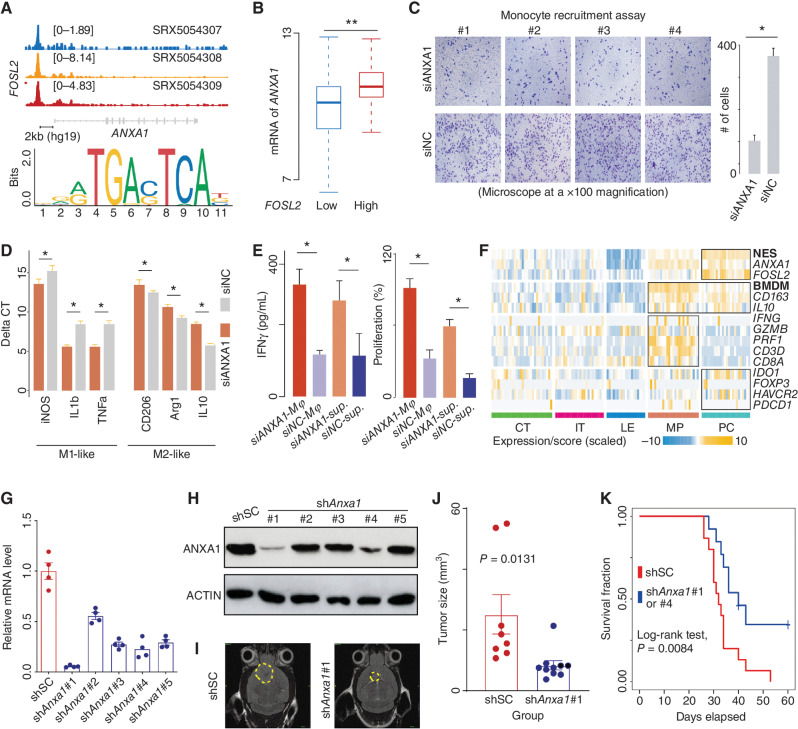
ANXA1 is associated with recruiting and polarizing macrophages to suppress CD8+ T cells. A, Top, ChIP-seq analysis of FOSL2 across three neural progenitor cells. The representative Integrative Genomics Viewer (IGV) tracks at the ANXA1 locus show the distribution of peaks upstream of the transcription start site (TSS; <5 KB). Middle, snATAC analysis of GBM cells. The representative IGV tracks at the ANXA1 locus show the location with significant peaks upstream of the TSS (<5 KB). Bottom, binding motif of FOSL2 (from JASPAR). B, Comparison of ANXA1 mRNA expression between TCGA IDH wild-type GBMs classified by the expression of FOSL2. Wilcoxon rank-sum test; **, P < 0.01; *, <0.05. C, Comparison of the migration ability of monocytes between the indicated groups (siANXA1 or siNC) based on transwell assay (microscope at ×100 magnification). D, mRNA level of indicated genes measured by qRT-PCR using the delta-delta Ct method. E, Comparison of IFNγ level (left) and proliferation percentage (right) of CD8+ T cells among indicated groups. F, A heat map for expression of indicated genes and signature scores among different regions. qRT-PCR (G) and immunoblot (H) analysis of Anxa1 mRNA expression in GL261 cells transduced with lentiviral vectors carrying five shRNAs. I, Representative MRI from mice after intracranial injection of GL261 with lentiviral vectors carrying scrambled shRNA or shAnxa1. T2 sequences demonstrate infiltrative tumors in the mouse brain (yellow line). J, Tumor volume was measured by the T2 MRI scan. K, Survival analysis of cases treated with shSC or shAnxa1.

