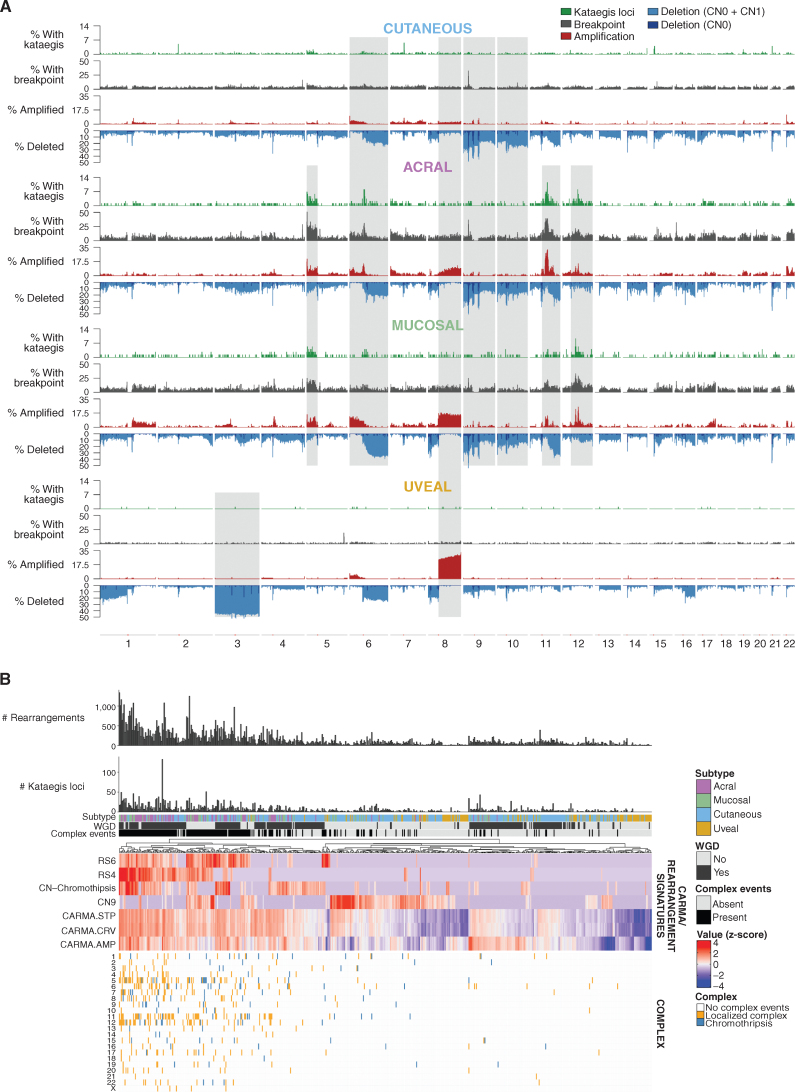
Figure 3.
Rearrangements, CNAs, and complex rearrangement events. A, Distribution of (top to bottom) the percentage of tumors with kataegis loci (green), a rearrangement breakpoint (gray), a CNA with amplifications (red), and deletions (CN0 + CN1, blue) in 100-kb regions across the genome in each melanoma subtype. Regions of similarity and difference in the pattern of kataegis, breakpoints, and CNA between subtypes are shaded gray. B, Complex events in each tumor. From top to bottom: number of rearrangements, number of kataegis loci, melanoma subtype, presence of WGD, presence of complex rearrangement events, heat map of measures of complexity, and presence of complex events in each chromosome in each tumor. For the heat map of measures of complexity, tumors were clustered using various measures that indicate the presence of complex structural rearrangements and chromosomal instability, including chromothripsis-related CN signatures (CN chromothripsis: CN5 + CN6 + CN7 + CN8), diploid chromosomal instability CN signature CN9, clustering rearrangement signatures (RS4 and RS6), and CARMA features of amplification (AMP) and complexity (STP and CRV). For clustering, z-score–transformed values for each factor were used.

