. 2022 Sep 13;12(12):2856–2879. doi: 10.1158/2159-8290.CD-22-0603

Figure 4.

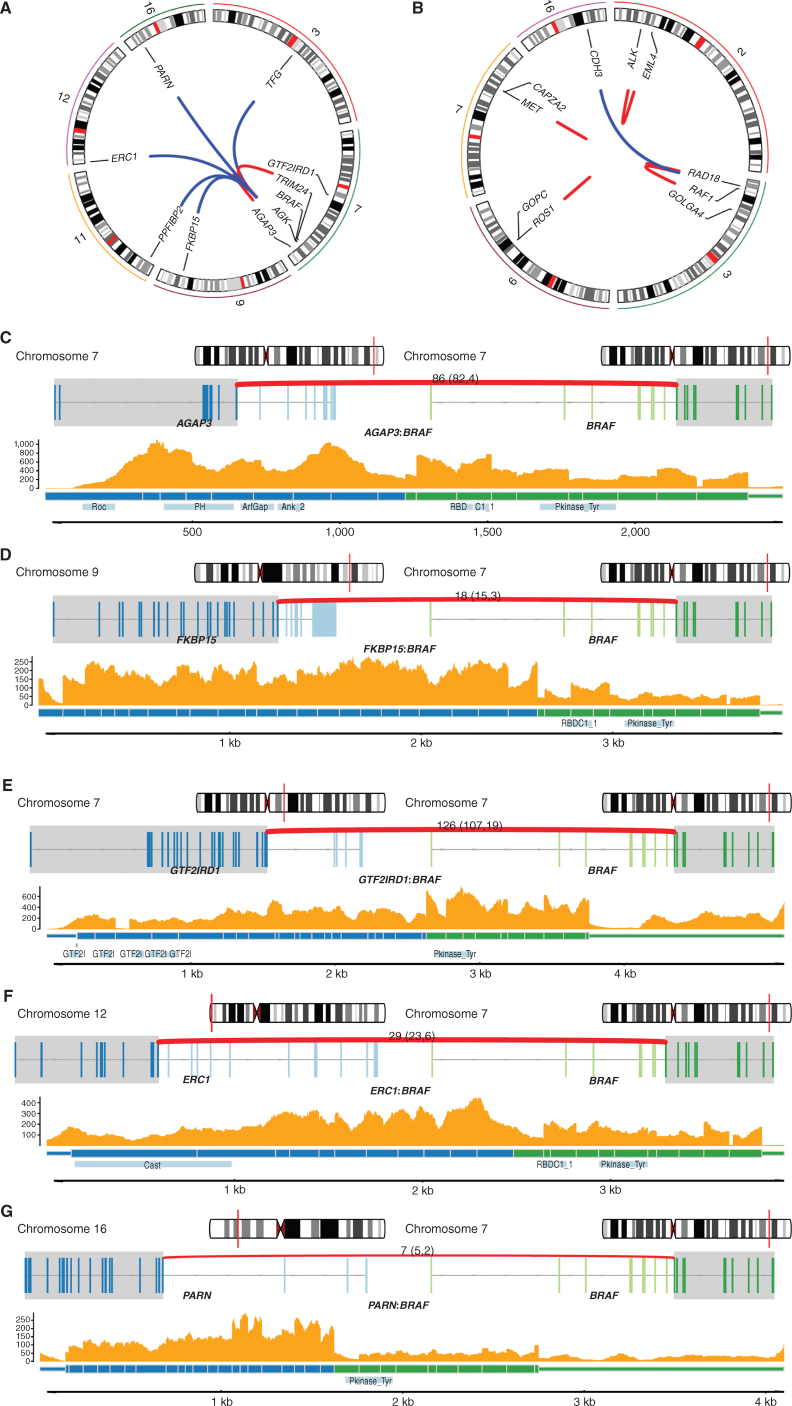
Figure 4. Cancer gene fusions A, Circos plot showing the nine BRAF gene fusion events and the corresponding fusion gene partner. Only chromosomes containing the genes involved in the gene fusions are shown. B, Circos plot showing RAF1, ALK, MET, and ROS1 gene fusion events of interest and the corresponding fusion gene partner. Only chromosomes containing the genes involved in the gene fusions are shown. C–G, BRAF fusion genes in tumors with RNA-seq available. For each fusion gene, the top plot shows the location in the chromosome of each fusion gene partner; the middle plot shows the exons involved in each gene (transcripts are collapsed). The bottom plot shows the read depth of both fusion gene partners by RNA-seq, predicted fusion protein, and the protein domains (including BRAF kinase domain) involved. C, AGAP3–BRAF fusion; D, FKBP15–BRAF fusion; E, GTF2IRD1–BRAF fusion; F, ERC1–BRAF fusion; G, PARN–BRAF fusion.

Cancer gene fusions A, Circos plot showing the nine BRAF gene fusion events and the corresponding fusion gene partner. Only chromosomes containing the genes involved in the gene fusions are shown. B, Circos plot showing RAF1, ALK, MET, and ROS1 gene fusion events of interest and the corresponding fusion gene partner. Only chromosomes containing the genes involved in the gene fusions are shown. C–G, Examples of BRAF fusion genes in tumors with RNA-seq available. For each fusion gene, the top plot shows the location in the chromosome of each fusion gene partner, and the middle plot shows the exons involved in each gene (transcripts are collapsed). The bottom plot shows the read depth of both fusion gene partners by RNA-seq, predicted fusion protein, and the protein domains (including BRAF kinase domain) involved. C and D,AGAP3:BRAF fusion and FKBP15:BRAF fusion, respectively. E–G,GTF2IRD1:BRAF fusion, ERC1:BRAF fusion, and PARN:BRAF fusion, respectively.