. 2022 Sep 13;12(12):2856–2879. doi: 10.1158/2159-8290.CD-22-0603

Figure 6.

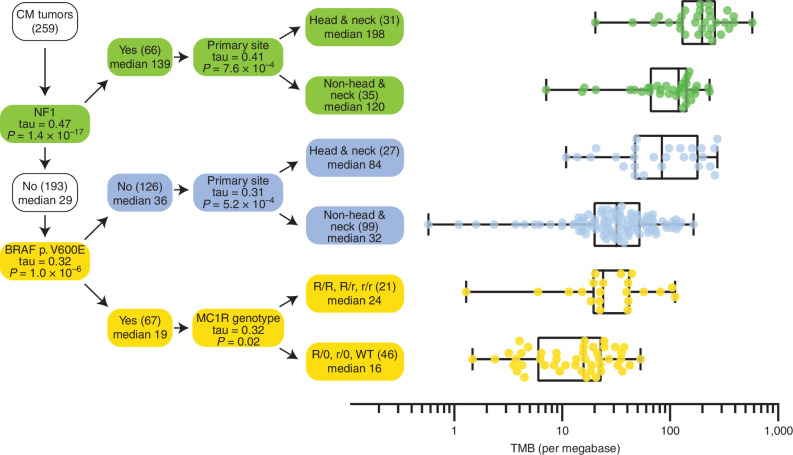
Figure 6. Decision tree predicting TMB in CM. Starting with CM tumors in the root node (top left), the variable that had the highest correlation with TMB was identified, e.g., NF1 mutation status. In the branching node, the correlation (Kendall's tau) with TMB and associated Bonferroni corrected P value is displayed. The branching node splits the cohort into two groups with size (in brackets) and median TMB is displayed in the daughter nodes. The splitting is repeated recursively until no more significant variables can be found. For each leaf node in the decision tree, the distribution of TMB is displayed on the right-hand side in the form of box-and-whisker plots with whiskers from minimum to maximum. Medians are displayed as a line within the box defined by the quartiles.

Decision tree predicting TMB in CM. Starting with CM tumors in the root node (top left), the variable that had the highest correlation with TMB was identified (i.e., NF1 mutation status). In the branching node, the correlation (Kendall's tau) with TMB and associated Bonferroni corrected P value is displayed. The branching node splits the cohort into two groups with size (in brackets), and median TMB is displayed in the daughter nodes. The splitting is repeated recursively until no more significant variables can be found. For each leaf node in the decision tree, the distribution of TMB is displayed on the right-hand side in the form of box-and-whisker plots with whiskers from minimum to maximum. Medians are displayed as a line within the box defined by the quartiles.