. 2022 Oct 28;12(12):2880–2905. doi: 10.1158/2159-8290.CD-21-1491

Figure 1.

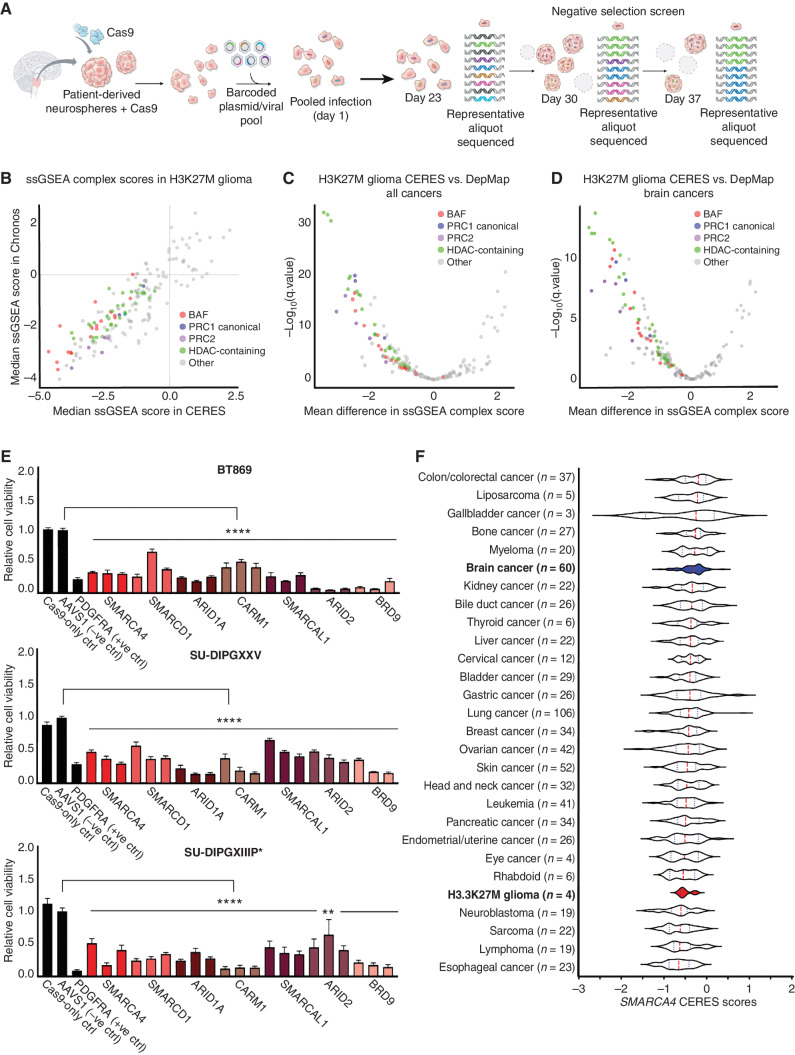
Figure 1. Epigenetic CRISPR screen identifies BAF complex as a novel dependency in pediatric H3K27M glioma. A, Schematic of epigenetic-focused CRISPR/Cas9-negative selection screen conducted in one H3WT-glioma and four H3.3K27M-glioma neurosphere models. B, ssGSEA of top-scoring protein complexes in four H3.3K27M-glioma models using Chronos and CERES dependency scores. C, Mean difference in ssGSEA complex scores (more negative scores indicate selective dependencies) for BAF, PRC1, PRC2, and HDAC-containing complexes in four H3.3K27M-glioma models compared with 855 human adult and pediatric cancer cell lines in the DepMap (Broad Institute). D, Mean difference in ssGSEA complex scores for BAF, PRC1, PRC2, and HDAC-containing complexes in four H3.3K27M-glioma models compared with 60 adult and pediatric brain cancer cell lines in the DepMap (Broad Institute). E, Relative cell viability across three H3.3K27M-glioma neurosphere lines following single-gene CRISPR/Cas9-mediated knockout of BAF complex genes (normalized to AAVS1-negative sgRNA control, n = 3). Three bars are shown per gene to indicate three individual sgRNAs used for knockout (sgRNA sequences are provided in Supplementary Table S5). Data are shown as mean ± SEM; ****, P < 0.0001; **, P = 0.0065. F, Dependency scores (CERES) for SMARCA4 in four H3.3K27M-glioma models compared with 23 other cancer types reported in the DepMap (Broad Institute). The median is indicated by the red dashed line, and quartiles are shown in dotted lines. Types of cancer models are displayed in descending order from least sensitive to knockout to the most sensitive (most negative median CERES score).

Epigenetic CRISPR screen identifies BAF complex as a novel dependency in pediatric H3K27M glioma. A, Schematic of epigenetic-focused CRISPR/Cas9-negative selection screen conducted in one H3WT-glioma and four H3.3K27M-glioma neurosphere models. B, ssGSEA of top-scoring protein complexes in four H3.3K27M-glioma models using Chronos and CERES dependency scores. C, Mean difference in ssGSEA complex scores (more negative scores indicate selective dependencies) for BAF, PRC1, PRC2, and HDAC-containing complexes in four H3.3K27M-glioma models compared with 855 human adult and pediatric cancer cell lines in the DepMap (Broad Institute). D, Mean difference in ssGSEA complex scores for BAF, PRC1, PRC2, and HDAC-containing complexes in four H3.3K27M-glioma models compared with 60 adult and pediatric brain cancer cell lines in the DepMap (Broad Institute). E, Relative cell viability across three H3.3K27M-glioma neurosphere lines following single-gene CRISPR/Cas9-mediated knockout of BAF complex genes (normalized to AAVS1-negative sgRNA control, n = 3). Three bars are shown per gene to indicate three individual sgRNAs used for knockout (sgRNA sequences are provided in Supplementary Table S5). Data are shown as mean ± SEM; ****, P < 0.0001; **, P = 0.0065. F, Dependency scores (CERES) for SMARCA4 in four H3.3K27M-glioma models compared with 23 other cancer types reported in the DepMap (Broad Institute). The median is indicated by the red dashed line, and quartiles are shown in dotted lines. Types of cancer models are displayed in descending order from least sensitive to knockout to the most sensitive (most negative median CERES score).