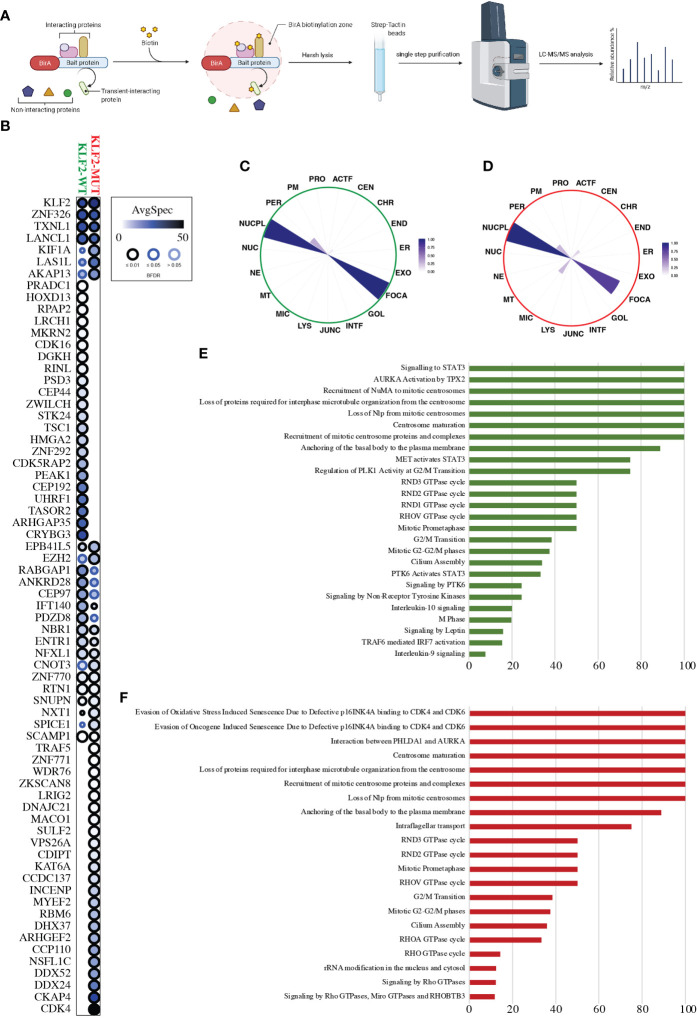
Figure 3.
KLF2 interactome analysis. (A) Schematic workflow overview of the MAC-tagged based BioID purification coupled with mass spectrometry. (B) Dot-plot visualization (BFDR ≤ 0.05) of the KLF2-WT and KLF2-MUT interactors (prohits-viz.org). Each node corresponds to the abundance of the average spectral count for each prey. (C, D) The polar plot shows the molecular level localization of KLF2-WT and KLF2-MUT obtained by MS-microscopy respectively (proteomics.fi). ACTF, Actin filament; JUNC, Cell junction; CEN, Centrosome; CHR, Chromatin; ER, Endoplasmic reticulum; END, Endosome; EXO, Exosome; FOCA, Focal adhesion; GOL, Golgi; INTF, Intermediate filament; LYS, Lysosome; MIC, Microtubule; MT, Mitochondrion; NE, Nuclear envelope; NUC, Nucleolus; NUCPL, Nucleoplasm; PER, Peroxisome; PM, Plasmamembrane; PRO, Proteasome. (E, F) Significantly enriched (q < 0.05, calculated with Fisher exact test and Benjamini–Hochberg multiple-testing correction) Reactome pathway annotations from the KLF2-WT and KLF2-MUT interactors, respectively. Y-axis corresponds to the percentage of the interactors found in the given pathway.

