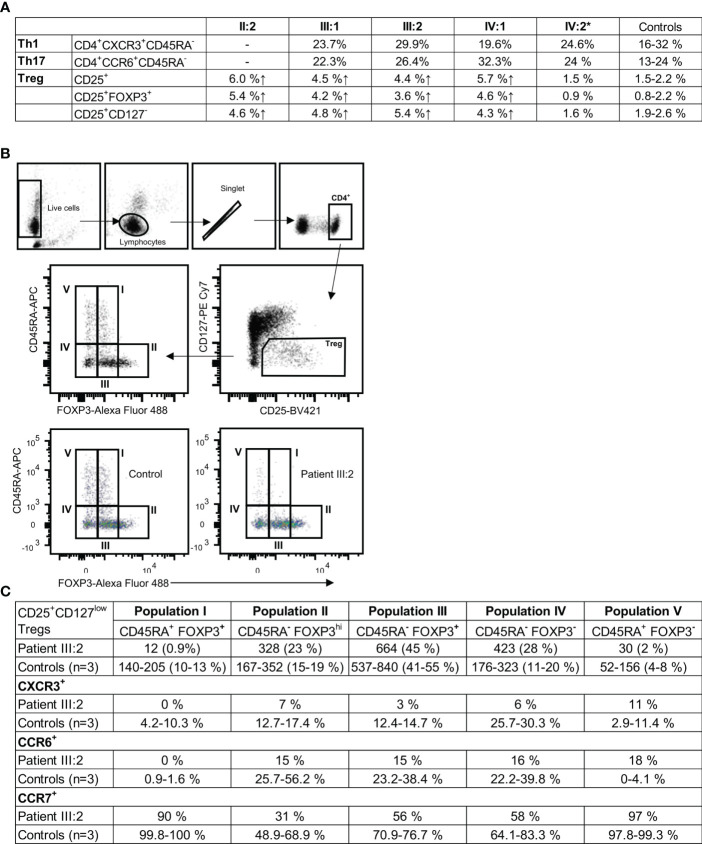
Figure 5.
(A) CD3+CD4+ T cell subgroups in KLF2 c.951dup p.(Glu318Argfs*87) variant positive family members compared to healthy controls. Mutation carriers´ and controls´ unstimulated PBMCs were stained for regulatory T helper cell markers CD4, CD25, CD127 and FOXP3 and analyzed by flow cytometry. Th1 and Th 17 subpopulations were stained ex vivo (whole blood) with CD4, CXCR3, CCR6, CD45RA and CD10 antibodies and analyzed by flow cytometry. (B) Representative results of flow cytometry analysis of CD25+CD127lowFOXP3+ regulatory T cells (Treg). The gating strategy is presented along with the data. Regulatory T cells of patient (III:2) and sex-matched controls´ were studied for the expression of CD45RA, CCR6, CCR7 and CXCR3 with flow cytometry. (C) The Treg populations I-V were studied for the expression of CCR6, CCR7 and CXCR3. Representative results of patient and control Treg populations are shown. The regulatory T cell populations I, II, III, IV and V are presented as the number of cells and percentages. The percentage of CXCR3, CCR6 and CCR7 positive cells.

