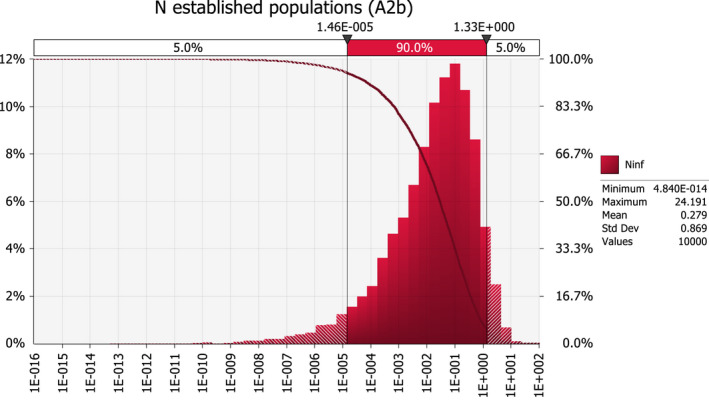
Figure 35.

Outcome of the model simulations for scenario A2b (additional RROs and climate change), showing the relative frequency and cumulative descending probability with log‐scale x‐axis. The number of Xcv populations established in the EU per year is estimated between 1.5 × 10⁻⁵ and 1.3 with a 90% probability
