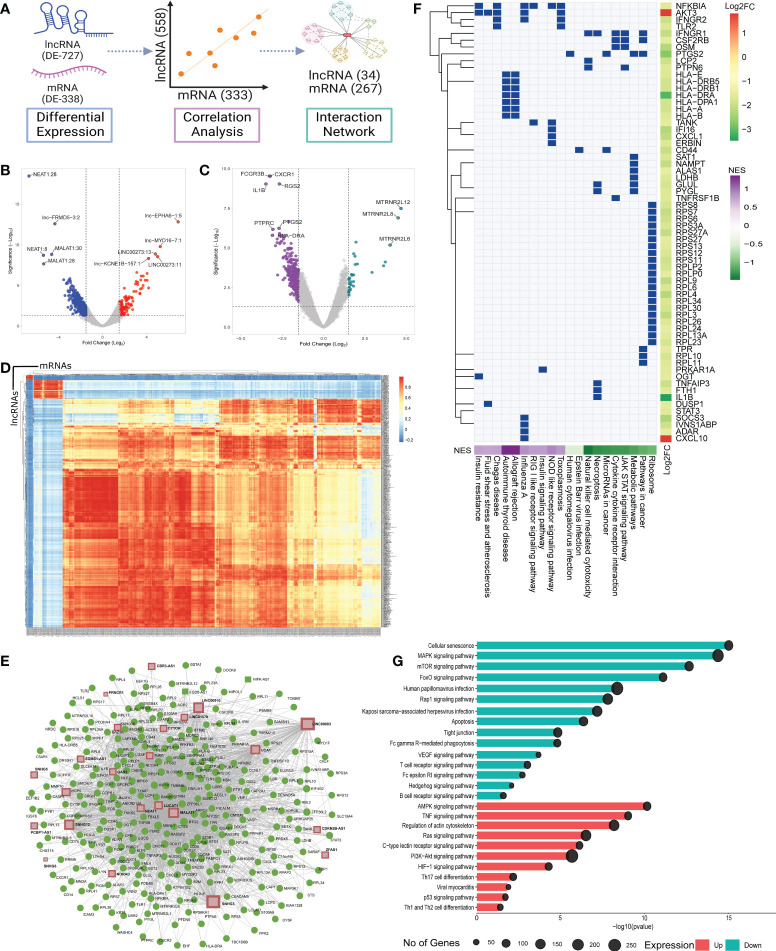
Figure 2.
Differential expression, Co-expression and functional Role of the lncRNAs and the mRNAs between the vaccination breakthroughs and the unvaccinated. (A) Illustration of the DE analysis of the lncRNAs and the mRNAs, lncRNA-mRNA co-expression and interactions. (B) and (C) Volcano plot of the differential expression of the lncRNAs and the mRNAs between the vaccination breakthroughs and the unvaccinated, respectively. (D) Heatmap representing Pearson correlation coefficient between the DE lncRNAs and the mRNAs. (E) LncRNA-mRNA interaction network with Green dots representing the mRNAs and brown squares for the lncRNAs. (F) GSEA of the network interacting genes. Green box indicates involvement of a gene in a specific pathway. Side color bar indicates Log2 fold change of the genes, while the bottom color bar indicates the Normalized Enrichment Score (NES) of the pathways. (G) Pathway enrichment of the network interacting lncRNAs. Color represents the expression of the pathways, and the circle size highlights the number of genes involved in the pathways.

