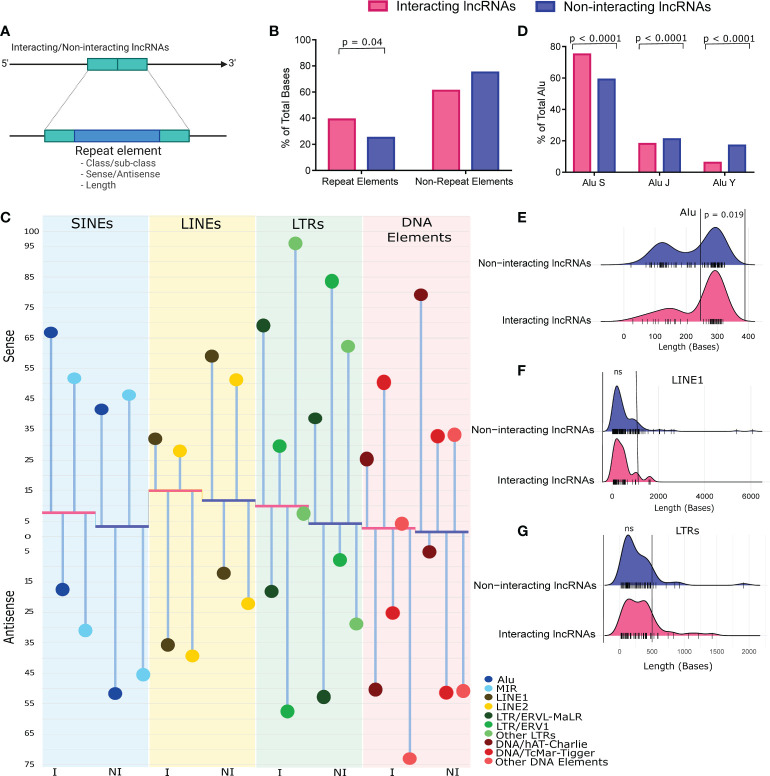
Figure 3.
Repeat element abundance, class/subclass, strand-specific differential presence and size range of the Repeats. (A) Working model of the repeat element abundance analysis. (B) Repeat element abundance between the vaccination breakthroughs and the unvaccinated. Total bases covered by repeat elements were normalized against total lncRNA length. (C) Repeat element class/sub-class, and their strand specific distribution between the two groups. Abundance of major repeat classes are represented by bars, while height of bars from baseline indicates the abundance of repeats normalized to the lncRNA length. The red base of the plot corresponds to interacting lncRNAs (I), while the blue base corresponds to the non-interacting lncRNAs (NI). Abundance of repeat sub-classes are represented as %age of the repeat class (lollipop plot). (D) Abundance of Alu subfamily between the two groups. Data is represented as %age of total Alu, normalized against total bases covered by the Alus. (E–G) Size distribution of (E) Alu, (F) LINE1, and (G) LTRs, normalized against the number of such repeats. The bars at the base of the ridge indicate the individual repeat element of that specific size (x-axis).

